Figure 1.
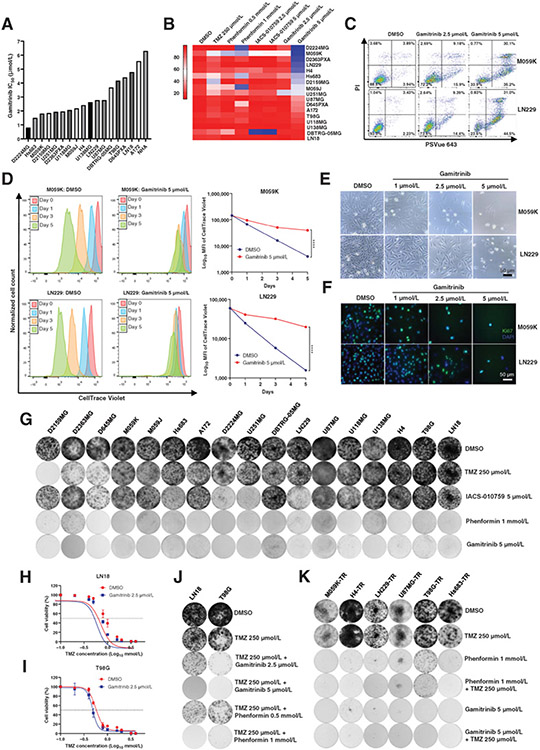
Therapeutic efficacy of Gamitrinib in glioma cells. A, The IC50 value of Gamitrinib for 17 human glioma cell lines and normal human astrocyte (NHA). B, Heatmap of cell viability for 17 glioma cell lines following treatment with the DMSO, TMZ at 250 μmol/L, Phenformin at 0.5 and 1 mmol/L, IACS-010759 at 2.5 and 5 μmol/L, and Gamitrinib at 2.5 and 5 μmol/L for 4 days. C, FACS data of M059K and LN229 cells. Cells were treated with indicated drugs and doses for 4 days and stained with PI and PSVue 643, and then analyzed by FACS. D, M059K and LN229 cells were labeled with CellTrace Violet and then treated with Gamitrinib at 5 μmol/L. The fluorescence intensity of CellTrace Violet was measured by FACS at days 0, 1, 3, and 5. Data were representative of 3 biological replicates. E, Phase contrast images of M059K and LN229 cells treated with Gamitrinib at 0, 1, 2.5, and 5 μmol/L for 4 days. F, Immunofluorescence staining images of M059K and LN229 cells treated with or without Gamitrinib at 5 μmol/L for 4 days. Blue indicated the DAPI staining whereas green indicated the Ki67 staining. G, Crystal violet staining images for 17 glioma cell lines. Cells were treated with DMSO, TMZ at 250 μmol/L, Phenformin at 1 mmol/L, IACS-010759 at 5 μmol/L, and Gamitrinib at 5 μmol/L for 8–14 days. Then cells were fixed and stained with crystal violet. H and I, The IC50 value of TMZ for LN18 and T98G cell lines treated with DMSO or Gamitrinib at 2.5 μmol/L. J and K, Crystal violet staining images for LN18 and T98G cell lines (J) or TMZ-resistant (TR) cell lines (K) treated with indicated drugs for 8–14 days; ****, P < 0.0001.

