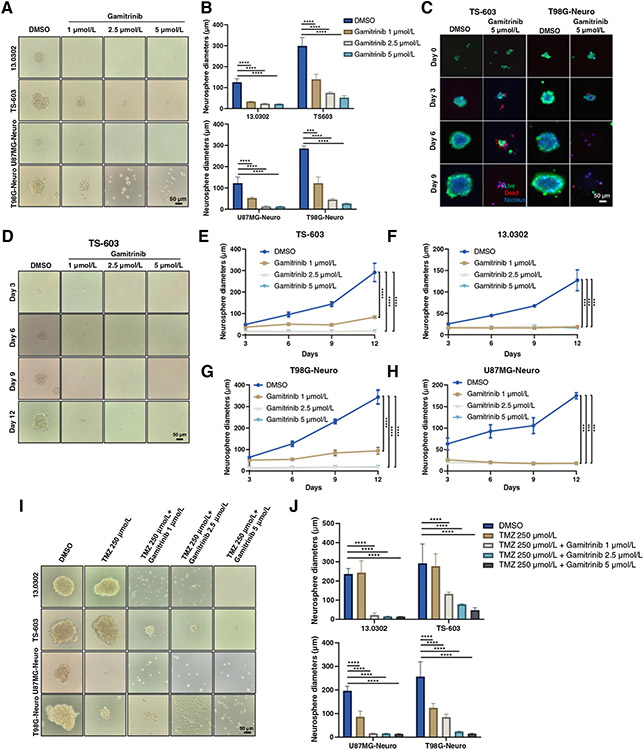
Figure 2.
Antitumor activity of Gamitrinib in neurospheres. A and B, Phase contrast images of neurospheres that were treated with titrated doses of Gamitrinib for 6 days (A) and diameters of 4 to 5 representative neurospheres were measured (B). C, Immunofluorescence staining images of TS-603 and T98G neurospheres. Cells were treated with Gamitrinib at 5 μmol/L for 9 days and live/dead staining was performed at days 0, 3, 6, and 9. Green indicated live cells; red indicated dead cells; blue indicated nucleus. D, Phase contrast images of TS-603 neurospheres treated with or without Gamitrinib at indicated doses. E–H, Neurosphere growth curves for TS-603 (E), 13.0302 (F), U87MG (G), and T98G (H) treated with or without Gamitrinib at 5 μmol/L. I, Phase contrast images of neurospheres that were treated with indicated drugs for 6 days. J, Diameters of 4 to 5 representative neurospheres; ***, P < 0.001; ****, P < 0.0001.

