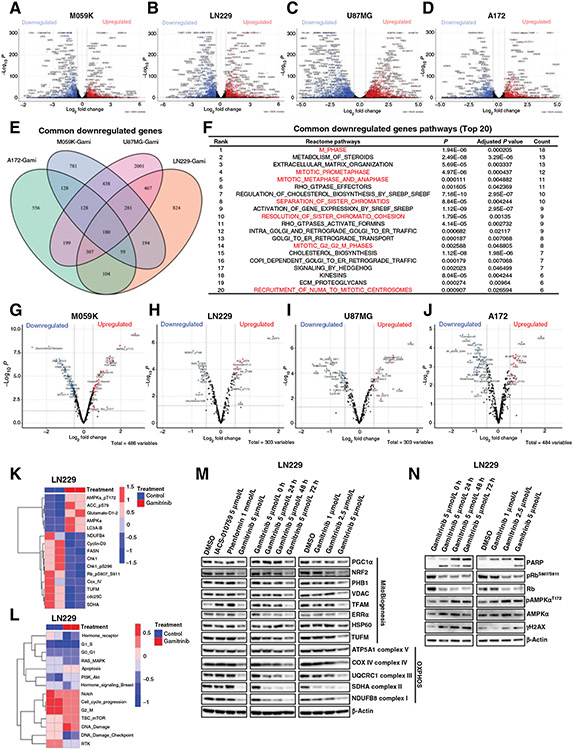
Figure 5.
Integrated computational analyses of transcriptomic and proteomic data in glioma cells treated with Gamitrinib. A and D, Volcano plots of differentially expressed genes in M059K (A), LN229 (B), U87MG (C), and A172 (D) cells treated with or without Gamitrinibat 5 μmol/L for 72 hours. x and y axes represent log2 fold change (FC) and −Log10 P, respectively. Gray dots indicated non-significant genes; blue dots indicated significantly downregulated genes; and red dots indicated significantly upregulated genes. E, Venn plot indicated the common downregulated genes across 4 cells treated with Gamitrinib. F, Gene set enrichment analysis indicated the top 20 ranked common pathways that were downregulated by Gamitrinib. G–J, Volcano plots of differentially expressed proteins in M059K (G), LN229 (H), U87MG (I), and A172 (J) cells treated with or without Gamitrinib at 5 μmol/L for 72 hours. K and L, Heatmaps of differentially expressed proteins indicated mitochondrial biogenesis, OXPHOS, apoptosis, and cell-cycle signaling pathway (K) and RPPA pathway scores (L) in LN229 cells treated with or without Gamitrinib for 72 hours. M and N, Immunoblot analysis of mitochondrial biogenesis and OXPHOS proteins (M) and cell cycle, apoptosis, and DNA damage proteins (N) in LN229 cells treated with or without 5 μmol/L Gamitrinib.

