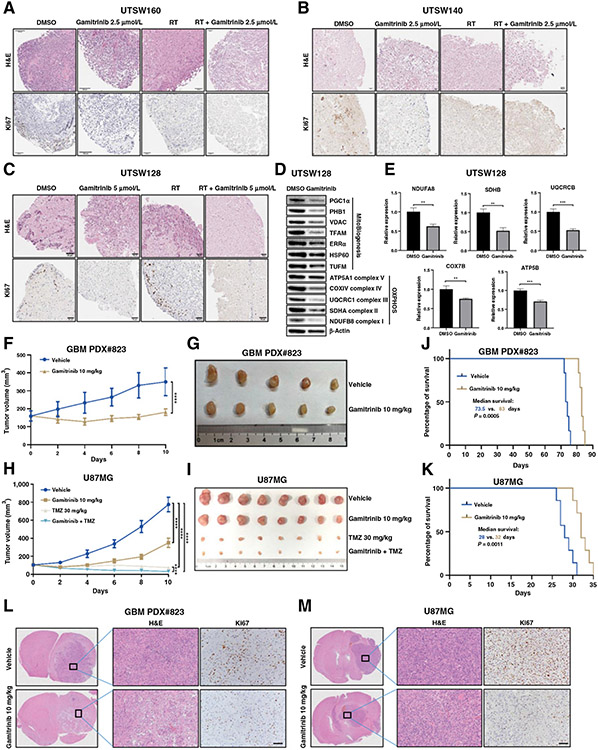
Figure 6.
Antitumor activity of gamitrinib in GBM PDOs, CDX, and PDX models. A–C, The hematoxylin and eosin (H&E) and Ki67 IHC staining of the GBM organoids UTSW 160 (A), UTSW140 (B), and UTSW128 (C). PDOs were treated with the DMSO control, Gamitrinib at 2.5 or 5 μmol/L, radiotherapy at 10 Gy, and Gamitrinib at 2.5 or 5 μmol/L plus radiotherapy at 10 Gy. D, Immunoblot analysis of mitochondrial biogenesis and OXPHOS proteins in GBM PDOs (UTSW128) treated with DMSO control or Gamitrinib at 5 μmol/L. E, Relative mRNA expression of OXPHOS genes in GBM PDOs (UTSW128) treated with DMSO or Gamitrinib. F and G, The tumor growth curve (F) and tumor images (G) of GBM PDX#823 tumor. Tumor-bearing mice were treated with control or Gamitrinib at 10 mg/kg every other day. Mice were sacrificed 10 days after Gamitrinib treatment. H and I, The tumor growth curve (H) and tumor images (I) of U87MG tumor. Tumor-bearing mice were treated with control, Gamitrinib at 10 mg/kg, TMZ 30 mg/kg, and Gamitrinib at 10 mg/kg plus TMZ 30 mg/kg every other day. Mice were sacrificed 10 days after Gamitrinib treatment. J and K, Kaplan–Meier survival curves of orthotopic PDX#823 (J) and U87MG (K) models. Six mice for each group in orthotopic PDX#823 models, and 7 mice for each group in orthotopic U87MG models; Mantel–Cox log-rank test, two-tailed test. L and M, The H&E and Ki67 IHC staining of the orthotopic PDX#823 (L) and U87MG (M) models; scale bars, 50 μm. **, P < 0.01; ***, P < 0.001; ****, P < 0.0001.

