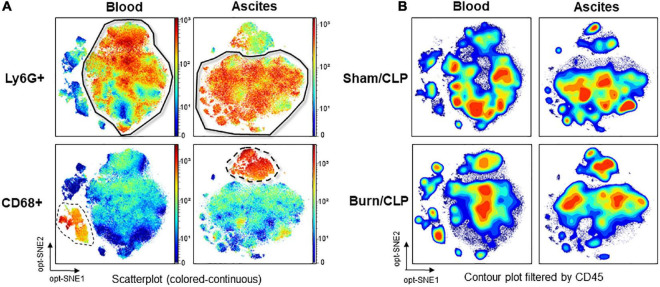
FIGURE 5.
Identification of neutrophils and monocytes/macrophages on the dimension reduction map and CD45 expression. (A) Identification of neutrophil islands based on Ly6G and monocyte/macrophage islands based on CD68 in the scatterplot (colored-continuous) of the dimension reduction map, all files concatenated, with the z-channel set to Ly6G or CD68. (B) The expression of CD45 in contour plot, with the files concatenated by groups. CD, cluster of differentiation; CLP, cecal ligation and puncture; Ly6G, lymphocyte antigen 6 G; opt-SNE, optimized parameters for T-distributed stochastic neighbor embedding.

