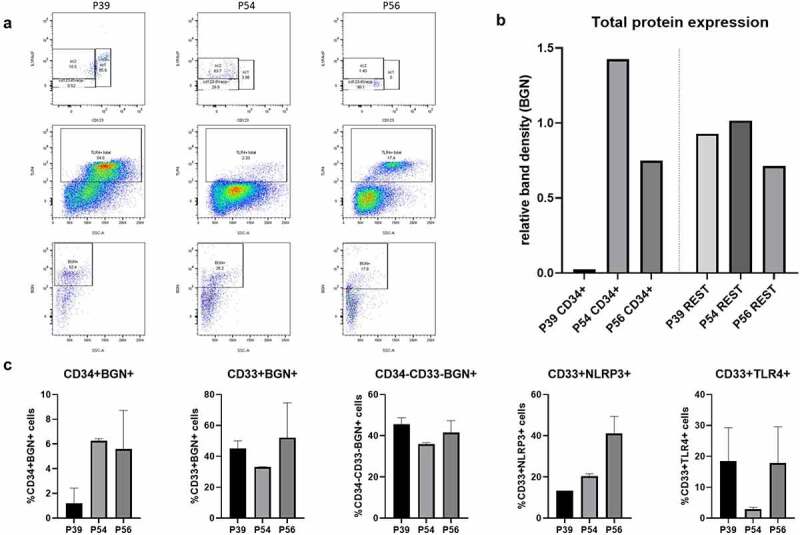
Figure 3.

Identification of BGN expressing MDS subpopulations in BM aspirates of sAML patients. (a) Flow cytometry analysis using 9 color ab panel as well as single staining with an anti-BGN ab for detection of the different MDS subpopulations and BGN surface expression. The distribution of CD34+ MDS-SC subpopulations of the sAML patients were identified using the CD123 and IL1RAcP markers (top) and total TLR4+ cells were calculated (middle), while surface BGN expression on the total cell population was additionally analyzed (bottom). (b) Densitometry analysis after Western blot of the total protein lysates of the three sAML patients (20 μg protein) from the CD34+ fraction (left) and the CD34− fraction (right) of the BM aspirates was loaded after magnetic separation of the cells and investigated for BGN expression (n = 1) as described in Materials and Methods. β-actin was used as a loading control. The relative band densities (BGN/ β-actin) are presented in the graph. (c) Quantification of inflammasome related molecules on fixed cell blocks from the BM aspirates of the three sAML patients. Five subpopulations of interest were investigated (CD34+BGN+, CD33+BGN+, CD34−CD33−BGN+, CD33+NLRP3+, CD33+TLR4+). The observed percentages were shown along with their SD, which derived from the quantification of these populations on 3 different cuts of the histoblock for each patient (n = 3, technical replicates/patient).
