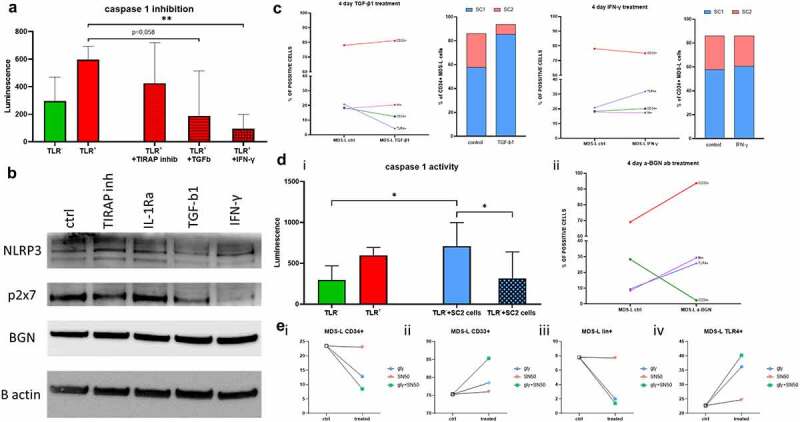
Figure 5.

Altered casp1 activity in MDS-L subpopulations by inflammasome inhibitors. (a) Casp1 activity measured via luminescence on the TLR4 subpopulation of MDS-L cells after stimulation with BGN (left) as well as additional stimulation with TIRAP inhibitors, TGF-β1 or IFN-γ. The mean luminescence and SD are presented in the graph. T- tests were conducted to determine statistical significance using the average of two measurements (technical replicates) in three (n = 3) independent experiments. (b) Western blot analysis investigating expression of BGN and the inflammasome related proteins P2X7 and NLRP3 in total MDS-L cells. The cells were either left untreated (ctrl) or treated with potential inhibitors of the pathway for 4 days (TIRAP inhibitors, IL-1Ra, TGF-β1 or IFN-γ). β-actin was used as a loading control for the comparisons between different treatments (n = 1). (c) Flow cytometric analysis of the MDS-L subpopulations after 4 day treatment with the different inhibitors of the inflammasome, TGF-β1 and IFN-γ. The different subpopulations are depicted with different colored lines (red: total CD33; green: total CD34; purple: lin; blue: TLR4), while the bar charts show the ratios of the two stem cell like populations before and after treatment (blue: SC1; red: SC2). The numbers on the Y axis represent percentage of cells gated on the total alive cells. (d) Comparison of casp1 activity (i) in the TLR4 subpopulation in untreated (green), recombinant BGN-treated cells (red) as well as co-cultured with the high BGN-producing stem cell subpopulation SC2, either alone (blue) or together with anti-BGN antibodies (blue-crossed). (ii) Flow cytometry analysis of total MDS-L cells treated for 4 days with the anti-BGN antibodies. The different subpopulations are depicted with different colors (red: total CD33; green: total CD34; purple: lin; blue: TLR4-blue). T tests were utilized for the identification of statistical significance. Both mean luminescence and SD are shown in the graph. Technical duplicates were used to eliminate possible errors, within the 3 biological replicates performed (n = 3). (e) Flow cytometry analysis of total MDS-L cells after treatment with the glyburide intermediate (blue circle), the NF-kB inhibitor SN50 (red triangle) or their combination (green square). The (i) CD34+, (ii) CD33+, (iii) lin+ and (iv) TLR4+ subpopulations were analyzed, before and after treatment to reveal a possible synergistic effect of blockade of both parts of the pathway (n = 1).
