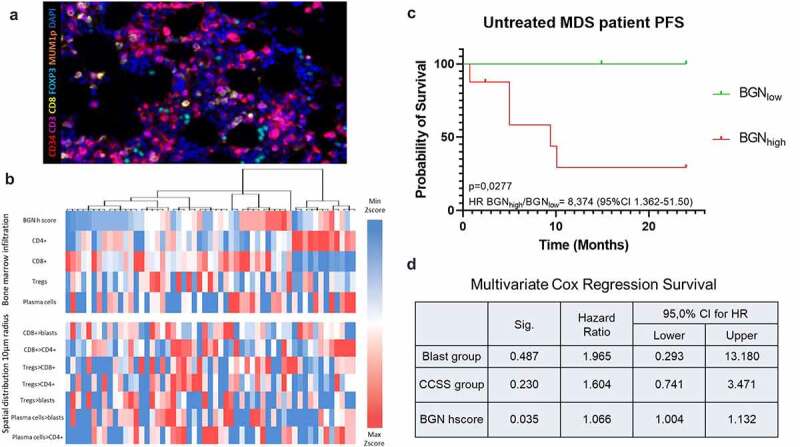
Figure 8.

Correlation of BGN with the immune cell signature and its clinical relevance. (a) Representative picture of BMB stained with Ab against CD34 (red), CD3 (violet), CD8 (yellow), FOXP3 (cyan), MUMp1 (Orange) and DAPI (blue). To standardize the spatial distribution analysis, three MSI fields at the x20 zoom (1872 × 1404 pixel, 0.5 µm/pixel) were manually selected on each slide based on representativeness and tissue size. Since the BMBs showed a high variability in quality, only areas with preserved architecture were chosen. (b) Hierarchical clustering and heat map of the BM of MDS/sAML patients, based on their infiltrate. Blue fields show numbers lower than the 10% percentile, white fields are values close to the median, while red fields are values higher than the 90% percentile. The upper part of the table represents the frequencies of cells in the BM, while the lower part the mean number of cell type A within a 10 μm radius of the cell type B (indicated as A > B). (c-d) Log-rank progression free survival analysis (c) as well as multivariate Cox Regression survival analysis (d) of 14 MDS patients that did not receive treatment, regarding their BGN expression in the BM alone or together with the two commonly used risk factor markers (blast numbers and cytogenetic score). In the univariate analysis, BGNlow (n = 6) patients are depicted with green, while BGNhigh (n = 8) patients with red. Statistical significance as well as the hazard ratio between patients is depicted for both uni- and multivariate analysis. For the Cox regression model, the BGN H scores were used as a continuous variable, instead of stratifying the patients in high and low expressors, in order to investigate the possible effect of an increased BGN H score on the PFS of patients.
