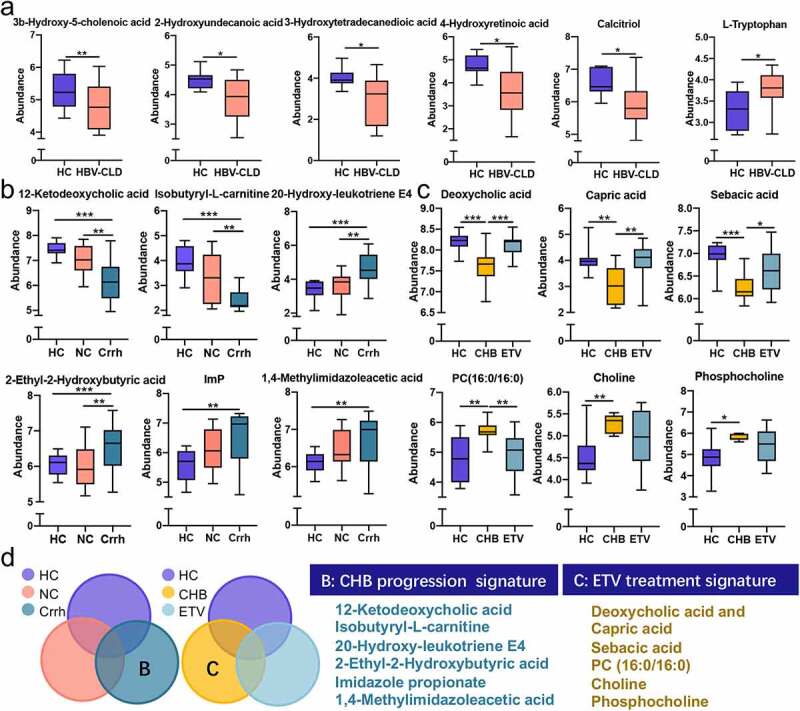
Figure 4.

:Distinct fecal metabolome signature of HBV-CLD patients and HCs. Representative metabolites that were significantly changed in HBV-CLD (a); correlated with disease progression (b); antiviral treatment (c); Venn diagram outlined the metabolites associated with disease progression and antiviral treatment (d). The abundance of metabolites was log-transformed with 0 values assigned with 1e-05. Box plots indicate median (middle line), 25th, 75th percentile (box) and maximum and minimum values (whisker). *pfdr<0.05, **pfdr<0.01, ***pfdr<0.001, ****pfdr<0.0001. CHB, chronic hepatitis B (treatment naive); Crrh, cirrhosis; ETV, entecavir; HBV-CLD, hepatitis B virus related chronic liver diseases; HC, healthy control; NC, non-cirrhosis.
