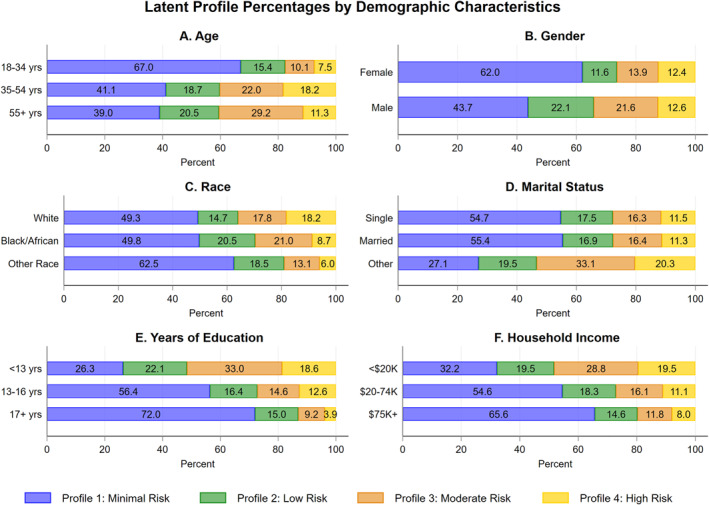
FIGURE 4.

Demographic differences and health disparities in latent Profiles. In these analyses, age, years of education, and household income were categorized into three groups to facilitate data interpretation and visualization. Older and male participants were more likely than younger and female participants to be in latent Profiles with more severe clinical characteristics. Participants reported other marital status, fewer years of education, and lower household income were also more likely to be in latent Profiles with more severe clinical characteristics.
