
Figure 6.
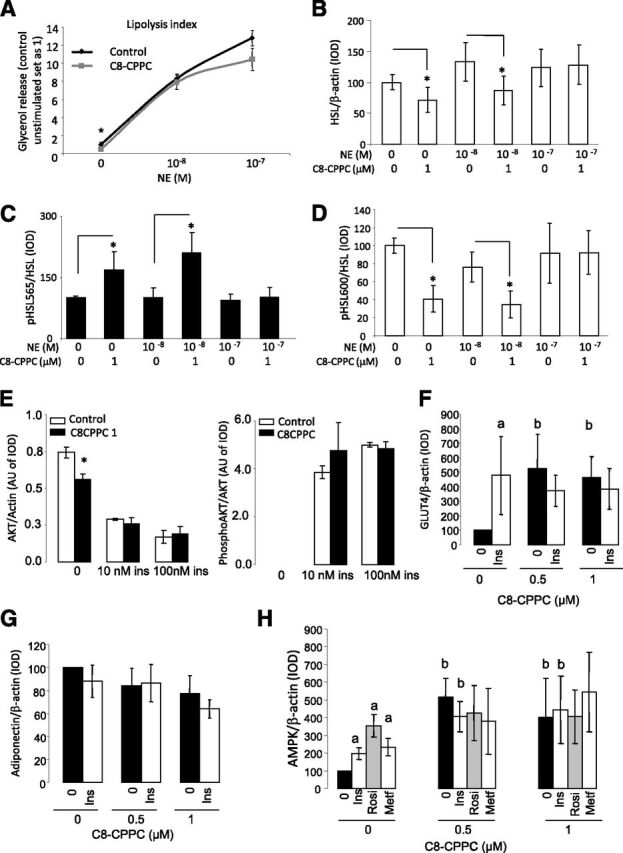
A: Glycerol release in 3T3-L1 adipocytes exposed for 48 h to C8-CPPC and stimulated with NE for 6 h. B–D: Results from Western blot analysis for phosphorylated (p) HSL/HSL ratio and total HSL in 3T3-L1 adipocytes exposed for 48 h to C8-CPPC and stimulated with NE for 6 h. Graphs show the mean ± SEM of two separated experiments: *P < 0.05. E: Effects of pharmacological inhibition of DEGS1 on insulin (ins) signaling. Results from Western blot analysis for p-AKT and AKT in 3T3-L1 adipocytes exposed 48 or 72 h with C8-CPPC 1 µmol/L and increased concentrations of insulin (10–100 nmol/L) for 15 min. F and G: Results from Western blot analysis for Glut4 and adiponectin in 3T3-L1 adipocytes exposed with C8-CPPC 0.5–1 µmol/L and insulin (100 nmol/L) for 48 h. H: Results from Western blot analysis for AMPK in 3T3-L1 adipocytes exposed to C8-CPPC 0.5–1 µmol/L and insulin (Ins) (100 nmol/L), rosiglitazone (Rosi) (1 nmol/L), and metformin (Metf) (100 nmol/L) for 48 h. aP < 0.05 vs. untreated cells (Ins, Rosi, or Metf effect); bP < 0.05 vs. 0 μmol/L C8-CPPC (C8-CPPC effect). AU, arbitrary units; IOD, integrated optical density.