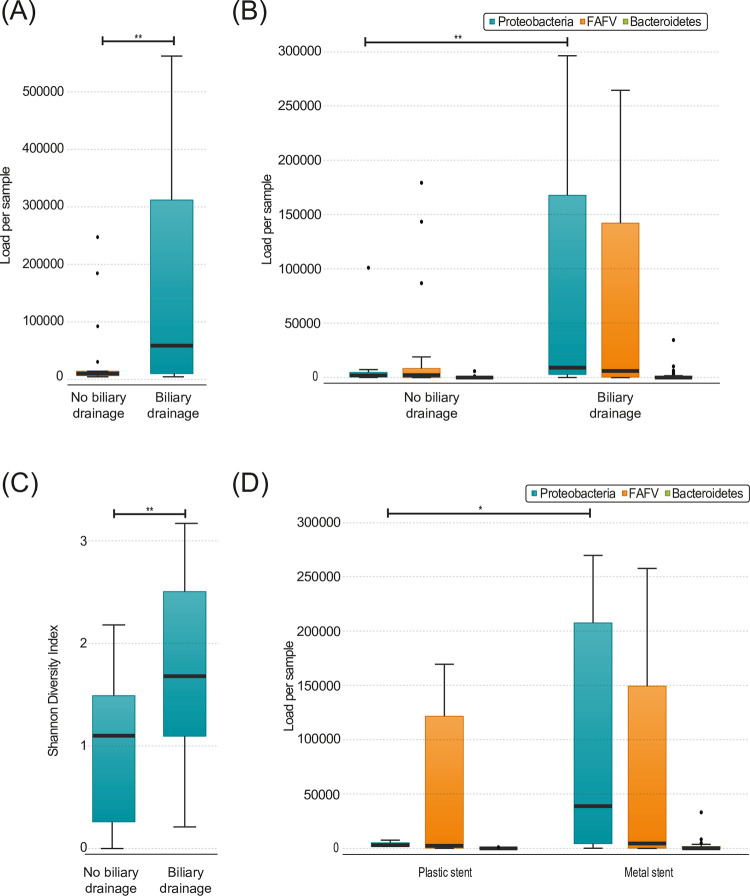
Fig 2.
(A) Total load in pancreatic biopsies, divided by patients with (n = 33) and without (n = 18) biliary drainage (p = 0.007) (B) Load per phylum in pancreatic biopsies, divided by patients with (n = 33) and without (n = 18) biliary drainage (Proteobacteria p = 0.003) (C) Shannon diversity index of pancreatic biopsies, divided by patients (n = 33) and without (n = 18) biliary drainage (p = 0.014) (D) Load per phylum in pancreatic biopsies, divided by patients with a plastic (n = 7) and a metal stent (n = 22) in the distal bile duct (Proteobacteria p = 0.032). Boxplots: Black bar denotes median, box denotes the interquartile range, whiskers indicate the range of values that are outside of the interquartile range. Outliers are defined as >1.5 times the size of the interquartile range and presented as a black dot.

