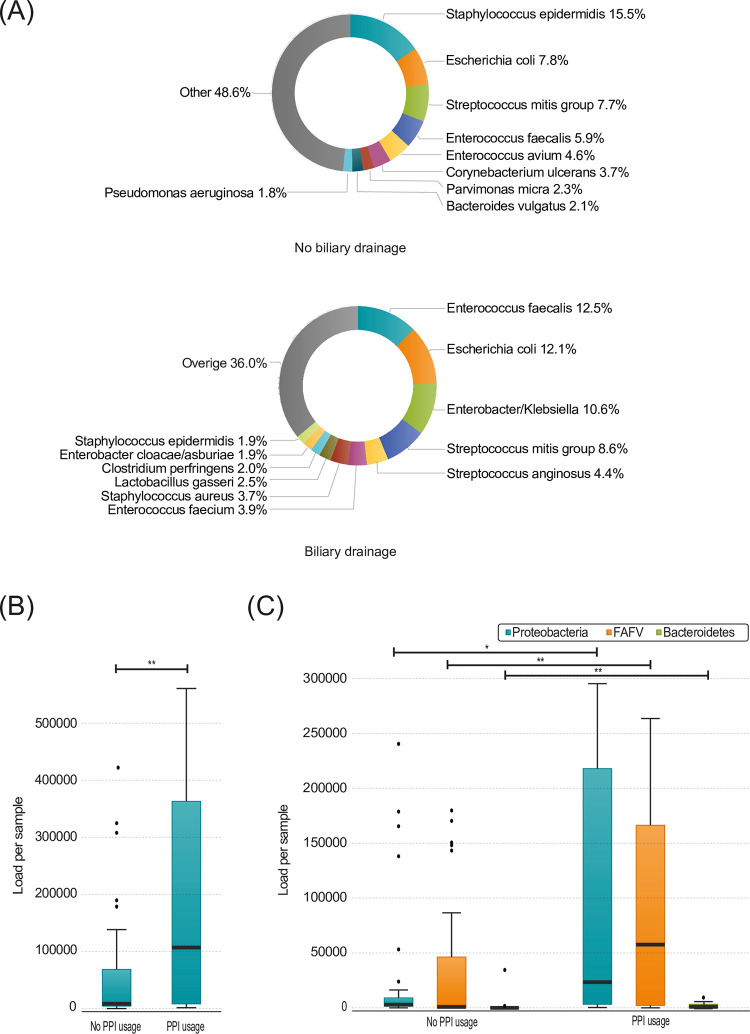
Fig 3.
(A) Species present in pancreatic biopsy samples with and without biliary drainage. Percentages are calculated over the total amount of bacteria. (B) Total load in pancreatic biopsies, divided by patients (n = 20) and without (n = 31) PPI usage (p = 0.007) (C) Load per phylum in pancreatic biopsies, divided by patients (n = 20) and without (n = 31) PPI usage (FAFV p = 0.008). Boxplots: Black bar denotes median, box denotes the interquartile range, whiskers indicate the range of values that are outside of the interquartile range. Outliers are defined as >1.5 times the size of the interquartile range and presented as a black dot. Abbreviations: PPI: Proton pump inhibitor.

