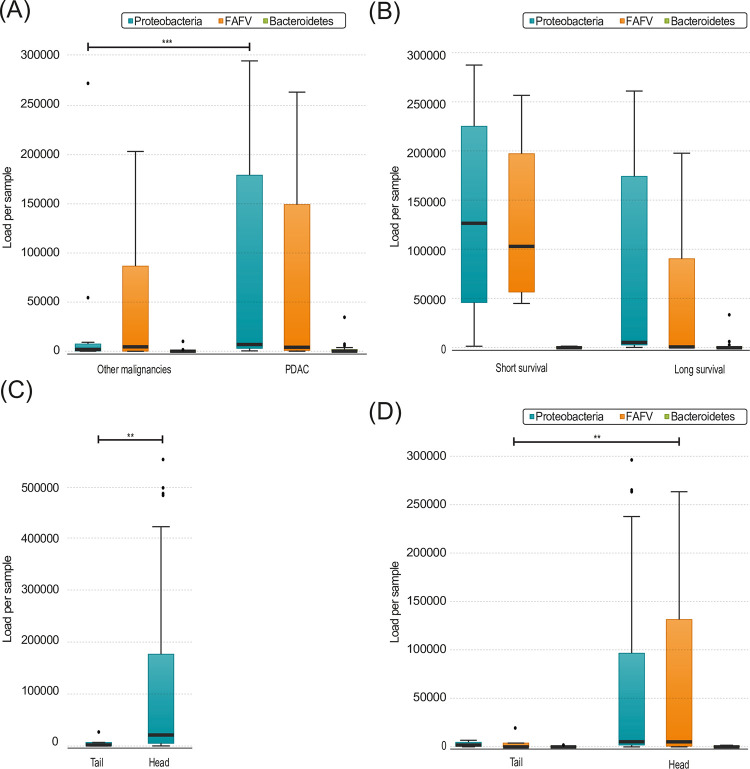
Fig 4.
(A) Load per phylum in pancreatic biopsies, divided by patients with PDAC (n = 27) and other malignancies (n = 14) (Proteobacteria p = 0.027) (B) Load per phylum in pancreatic biopsies of patients with PDAC, divided by patients with short (n = 4) and long survival (n = 15) (FAFV p = 0.062) (C) Total load in pancreatic biopsies, divided by head (n = 44) and tail (n = 7) biopsies (p = p = 0.004) (D) Load per phylum in pancreatic biopsies, divided by head (n = 44) and tail (n = 7) biopsies (FAFV p = 0.004, Proteobacteria p = 0.073). Boxplots: Black bar denotes median, box denotes the interquartile range, whiskers indicate the range of values that are outside of the interquartile range. Outliers are defined as >1.5 times the size of the interquartile range and presented as a black dot. Abbreviations: PDAC: Pancreatic ductal adenocarcinoma.

