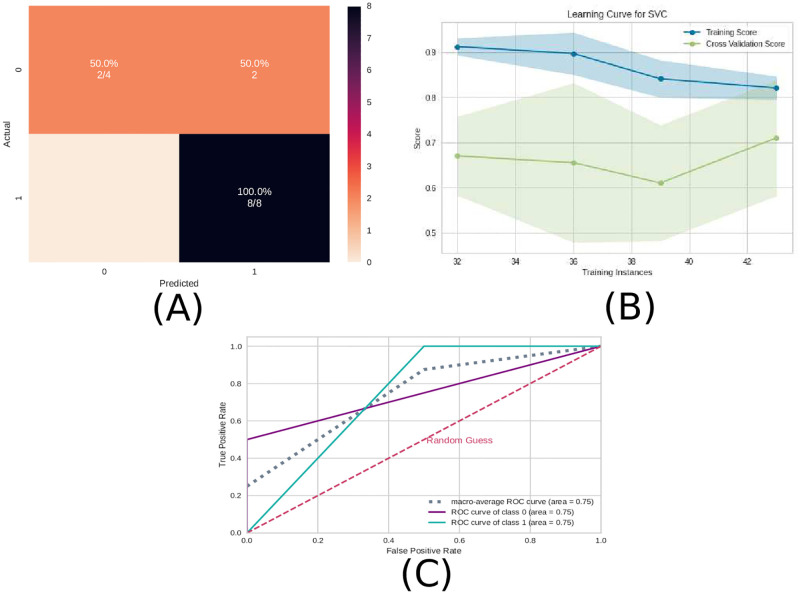
Fig 10. Machine learning results using the complex network measures as input data.
A) Confusion matrix indicating a true negative rate of 50% (orange according to the color bar) and a true positive rate of 100% (blue according to the color bar). B) Learning curve for the training accuracy (blue) and for test accuracy (green). C) ROC curve of class 0 (without ayahuasca) and class 1 (with ayahuasca). The gray dotted curve is the macro-average accuracy (area under curve = 0.75) and the pink one the random classifier.

