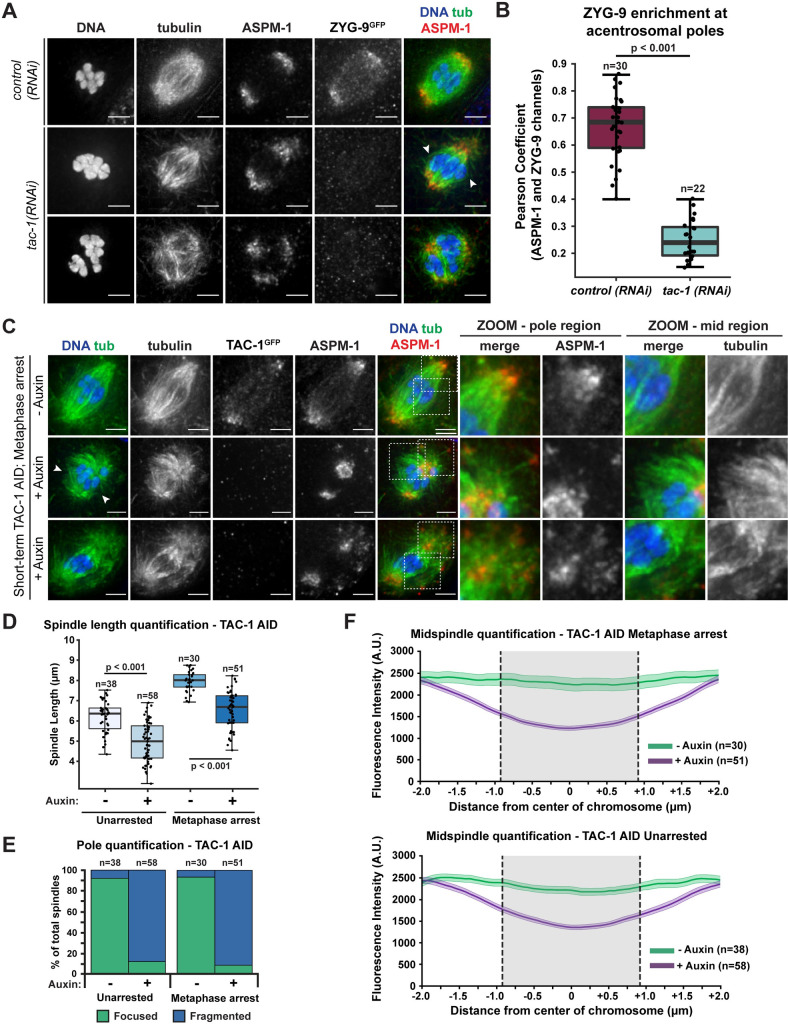
Fig 5. TAC-1 is required for proper ZYG-9 localization to oocyte meiotic spindles.
(A) IF imaging of oocyte spindles in the ZYG-9 AID strain in either control or tac-1(RNAi) conditions. Shown are DNA (blue), tubulin (green), ASPM-1 (red), and ZYG-9 (stained with a GFP antibody; not shown in merge). ZYG-9 enrichment at acentrosomal poles is lost in most spindles observed (20/22 spindles), and some spindles appear to have lost all ZYG-9 localization to the meiotic spindle; midspindle disruption is highlighted with arrowheads. Bars = 2.5μm. (B) Quantification of ZYG-9 enrichment at poles from oocyte spindles observed in (A); a Pearson coefficient was calculated for each image by comparing the ZYG-9 and ASPM-1 channels. Total spindles measured in each condition are noted above box plots; boxes represent first quartile, median, and third quartile. (C) IF imaging of metaphase-arrested oocyte spindles in the TAC-1 AID strain. Shown are DNA (blue), tubulin (green), ASPM-1 (red), and TAC-1 (stained with a GFP antibody; not shown in merge). In control oocytes, the poles are tightly organized and the midspindle microtubule bundles appear stable across the overlap zone. In auxin-treated oocytes, the TAC-1 signal is lost and spindle phenotypes are identical to those observed in ZYG-9 AID. Spindle pole integrity is compromised as shown by the ASPM-1 and tubulin coming off the poles (zooms–pole region) and midspindle microtubule bundles terminate near the center of the spindle and splay away from the chromosomes (arrowheads, zooms–mid region). Bars = 2.5 μm. (D) Quantification of spindle length (pole to pole) in unarrested and Metaphase I-arrested oocytes treated with either vehicle or 1mM auxin. Box represents the first quartile, median, and third quartile. Whiskers extend to maxima and minima. Significance determined using a two-tailed t-test. n represents the number of spindles analyzed. (E, F) Quantification of pole phenotypes (E) or midspindle splaying (F) from unarrested (vector control) and Metaphase I-arrested (emb-30(RNAi)) oocytes treated with either vehicle or 1mM auxin. Shaded regions of lines represent +/- SEM, and gray shading represents average length of chromosome in that condition. n represents the number of spindles analyzed.

