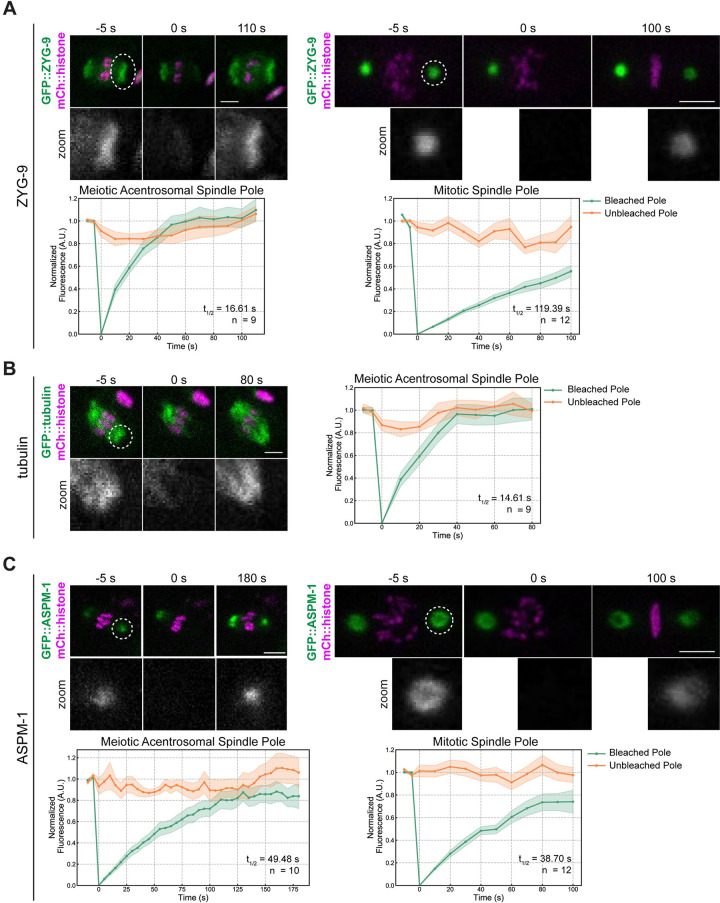
Fig 7. FRAP analysis of ZYG-9 and ASPM-1 at acentrosomal poles compared to at centrosomes.
(A-C) FRAP recovery curves and stills from movies for ZYG-9 (A), tubulin (B), and ASPM-1 (C) at meiotic and mitotic spindle poles (except for tubulin; only recovery at the meiotic spindle is shown). In graphs, the bleached pole curve is green, the unbleached pole curve is orange, the solid lines are the average, and the standard error of the mean is shaded. For all images, the specified bleached protein is in green and the chromosomes are in magenta. Zooms show only the bleached region. t1/2 was calculated from fitting the recovery curves to a single exponential function (Materials and Methods); see S5 Fig. n represents the number of spindles analyzed to generate each curve; movies for each condition were obtained across several days so represent multiple biological replicates. ZYG-9 is highly dynamic at acentrosomal spindle poles, displaying a similar recovery time to tubulin, while ASPM-1 turns over less rapidly and has similar dynamics at centrosome-containing and acentrosomal poles. Bars = 2.5μm (meiosis) and 5μm (mitosis).

