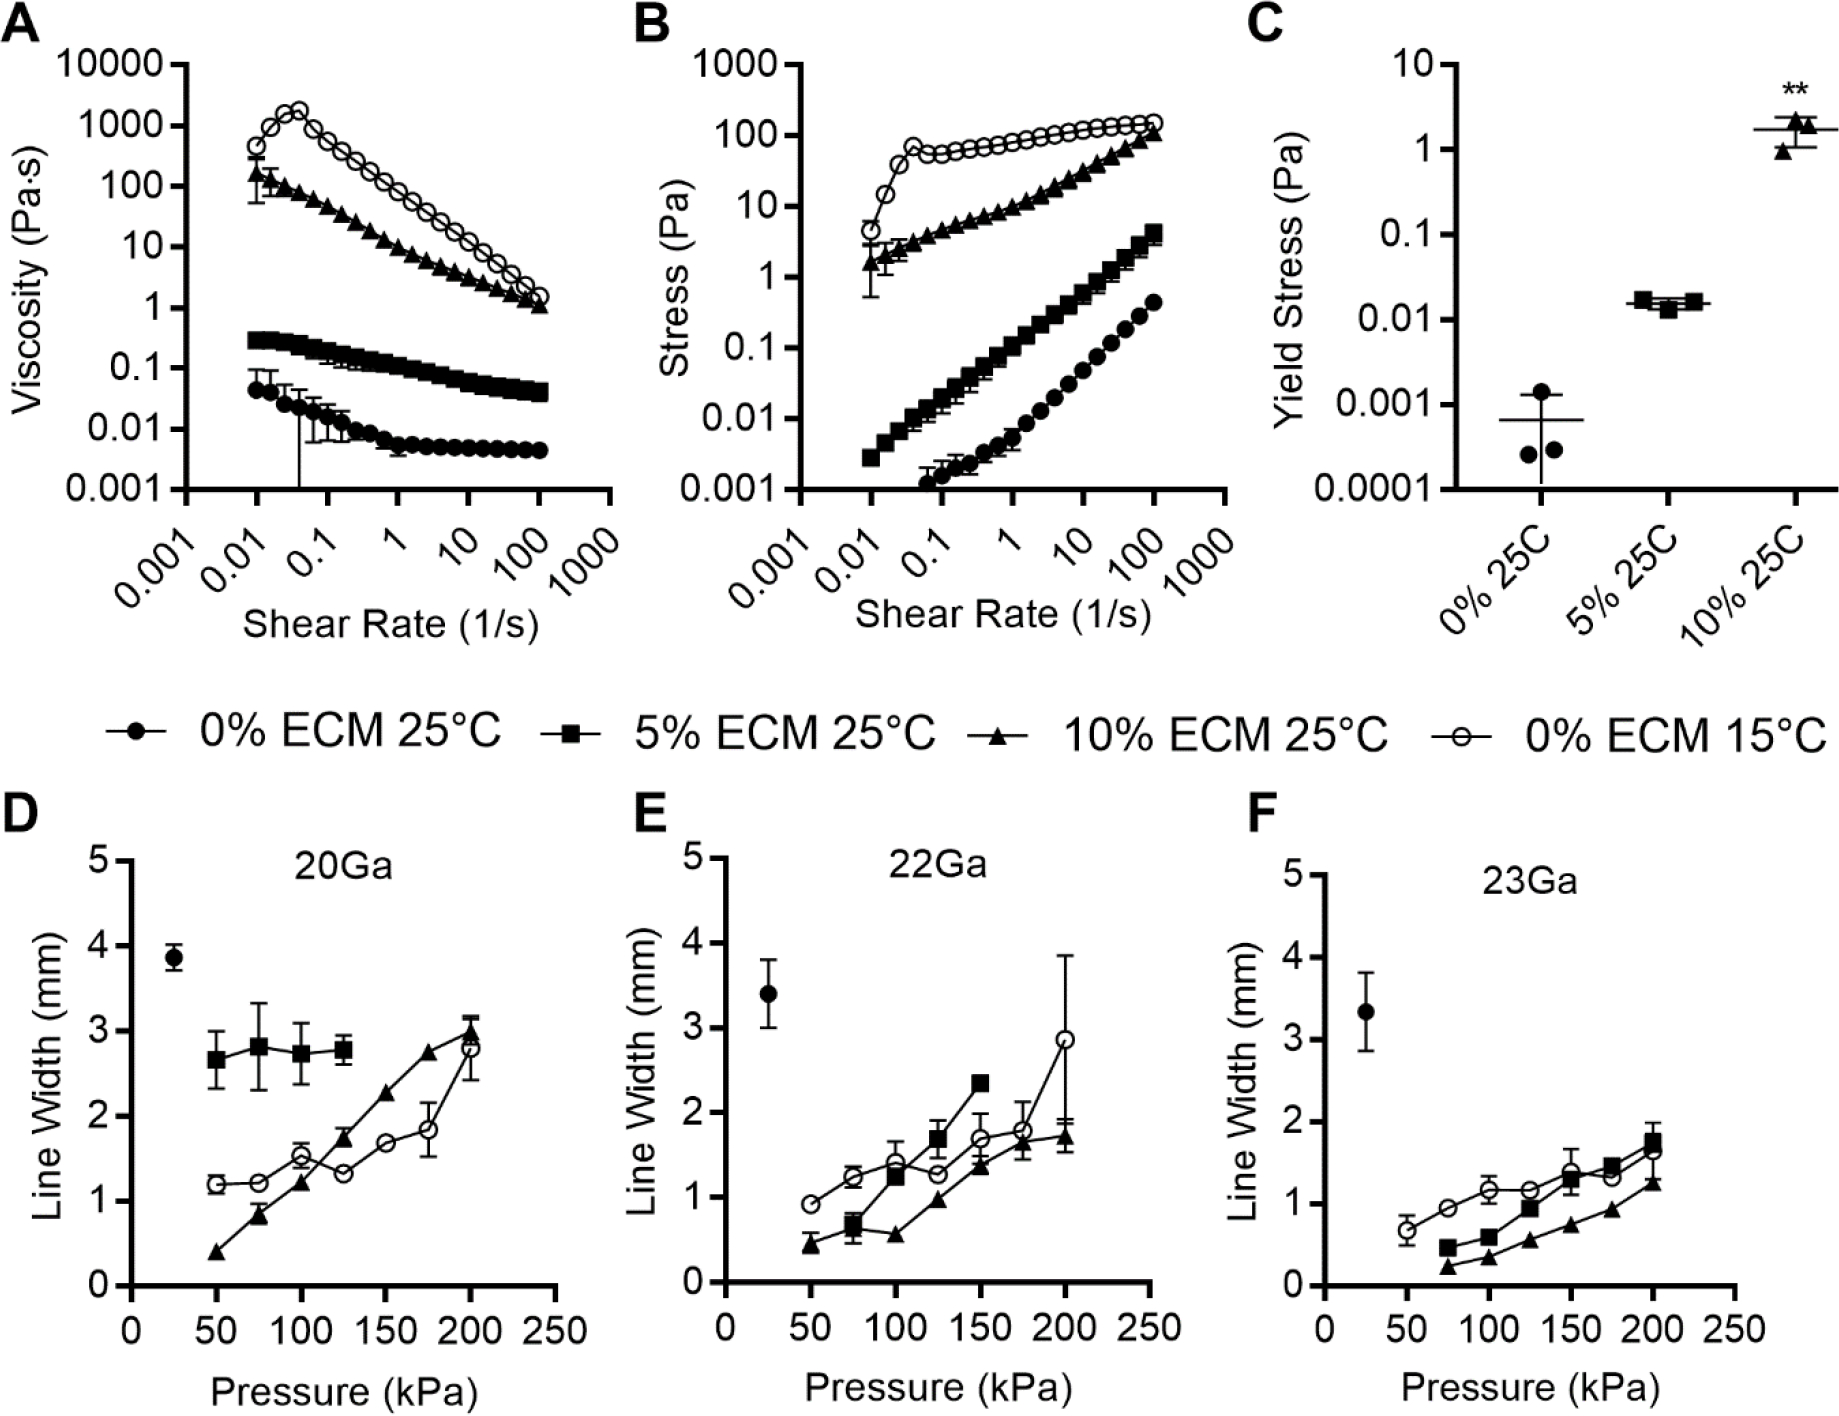
Figure 1:

dECM dose dependent rheology. 10% GelMA with dECM ranging from 0%–20% wt/v: A) Shear rate flow sweep, n = 3. B) Mean thixotropic hysteresis loops. C) Apparent yield stress, n =3, [**p<.01] between groups. D-F) Plot of filament thickness versus pressure for each bioink through 20Ga, 22Ga or 23Ga needles respectively, plotted as mean ± standard deviation n = 3, significance not shown for clarity, values shown in Supplemental Table 1.
