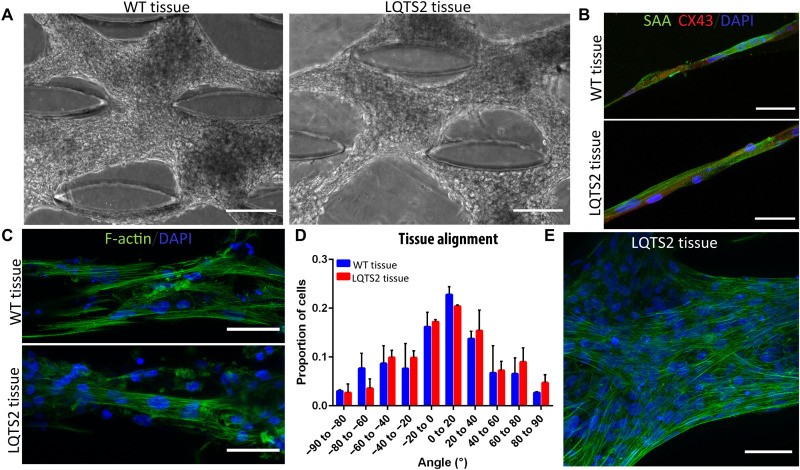
Fig. 6. Development of LQTS2 onachip.
Phase contrast images of tissue formation within microfluidic chips after 14 days of culture for isogenic (A) WT and LQTS2 tissues. Scale bars, 100 μm. (B and C) Immunostaining of WT (top) and LQTS2 (bottom) tissues formed in microfluidic chip after 14 days with (B) SAA (green), CX43 (red), and DAPI (blue) and (C) F-actin (green) and DAPI (blue). Scale bars, 50 μm. (D) Alignment analysis of nuclei within tissues at day 14. (E) Enlarged image of highly aligned (F-actin, green; DAPI, blue) LQTS2 tissue within the chip. Scale bar, 50 μm.

