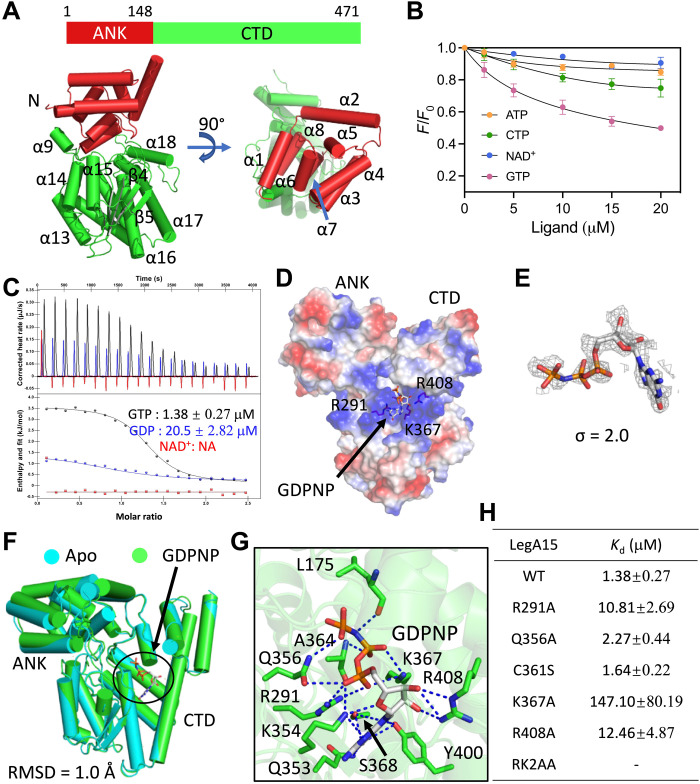
Fig. 4. LegA15 is a GTP-binding protein.
(A) A crystal structure of LegA15. Schematic diagram for protein domains is shown on the top, and a crystal structure is shown in a cartoon below. The N-terminalANK domain is in red, and the CTD is in green. The secondary structures are labeled. (B) Ligand binding analyses of LegA15 by synchronous fluorescence titration. LegA15 at 10 μM was used to titrate with 20 mM nucleotides. Y axis indicates relative fluorescence intensity of LegA15 to their initial intensity without ligands. (C) The GTP/GDP binding was analyzed by ITC. GTP/GDP/NAD+ are colored in black, blue, and red, respectively. Titration profiles are shown on the top, and fittings below. (D) A complex structure of LegA15 with a GTP analog GDPNP shown as a surface model colored according to the electrostatic surface potential [contoured from −5 kBT (red) to +5 kBT (blue)]. Residues in GDPNP binding are shown as stick models. (E) The simulated annealing omit map of GDPNP contoured at 2σ. The map in gray mesh is fitted with the ligand in a stick model. (F) Structural comparison of Apo-LegA15 (cyan) with its GDPNP complex (green). The difference is indicated by RMSD. (G) The detailed interaction of GDPNP in the binding pocket of LegA15. Stick models are shown for GDPNP in gray and amino acids in green important for the binding. Hydrogen bonds are highlighted in the blue dashed lines. (H) Mutations of key amino acids disrupted the LegA15 binding with GTP in ITC. All titration profiles are shown in fig. S7.

