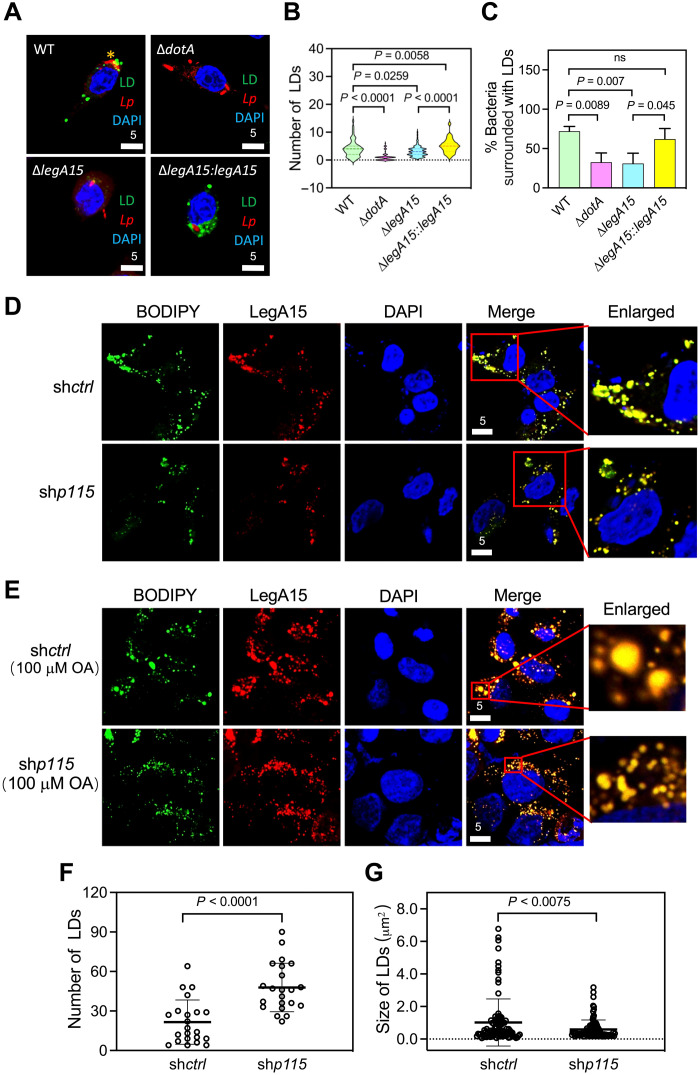
Fig. 6. The effects of LegA15 are dependent on p115.
(A and B) L. pneumophila infection led to LD accumulation of host cells. The Raw264.7 cells were infected by L. pneumophila at 0.1 multiplicity of infection for 12 hours and stained with Legionella-specific antibody in red. LDs were in green, and nuclei were in blue. Quantification of LD numbers (B) was calculated using more than 100 cells containing bacteria in ImageJ and analyzed by one-way ANOVA assay. (C) LegA15 promoted host LDs to LCV. Y axis represents a percent ratio of bacteria with LD at a close distance of less than 1 μm [yellow * in (A)]. The ratio was averaged of three times with more than 100 intracellular bacteria counted each time and analyzed by one-way ANOVA assay. (D to G) Intracellular LDs affected by the p115 knockdown. LegA15-mCherry shown in red was overexpressed in the p115 knockdown cells (D) and further treated with 100 μM sodium oleate (OA) for 16 hours (E). The number (F) and size (G) of LDs in 50 cells in (D) were measured in ImageJ and analyzed by one-way ANOVA assay. LDs were in green. Scale bars are in micrometer scale.

