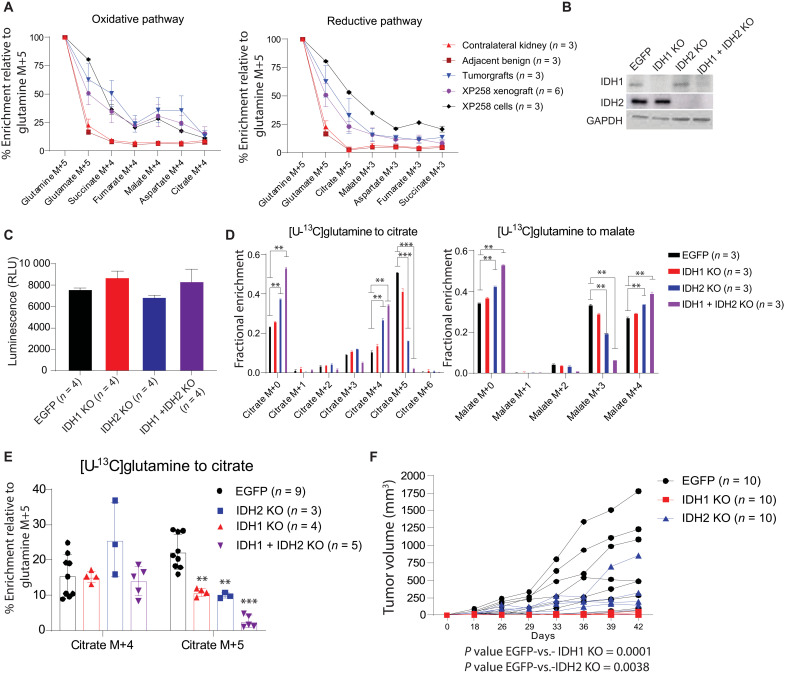
Fig. 3. IDH1 and IDH2 regulate reductive carboxylation and ccRCC growth.
(A) Percent enrichment of 13C relative to [U-13C]glutamine in TCA cycle from orthotopic XP258–derived orthotopic tumorgrafts, cell lines, and subcutaneous xenografts. Tumor-bearing mice were infused with [U-13C]glutamine for 5 hours, and XP258 cells were labeled in culture with [U-13C]glutamine for 4 hours. (B) Western blot showing the abundance of IDH1 and IDH2 in single- and double-knockout (IDH1 + IDH2 KO) cells generated using lentiviral CRISPR-Cas9. Enhanced green fluorescent protein (EGFP) is a control cell line with a guide RNA targeting EGFP. (C) Viable cell content in EGFP, IDH1 KO, IDH2 KO, and IDH1 + IDH2 KO XP258 cells assessed using Promega CellTiter-Glo. RLU, relative light unit. (D) Fractional enrichment of 13C-labeled isotopologues of citrate and malate in cells after 4 hours of culture with [U-13C]glutamine. One-way ANOVA was used to assess the significance of 13C enrichment in citrate and malate (n = 3). (E) Percentage enrichment of citrate M+4 and citrate M+5 relative to [U-13C]glutamine in EGFP, IDH1 KO, IDH2 KO, and IDH1 + IDH2 KO XP258 tumors. Mice were infused with [U-13C]glutamine for 5 hours. Data are from three or more xenografts generated subcutaneously in NOD-SCID mice. One-way ANOVA with a pairwise t test was used to determine the statistical significance. (F) Growth of EGFP, IDH1 KO, and IDH2 KO subcutaneous XP258 xenografts in NOD-SCID mice (n = 10, each cell line). P values were calculated using a mixed-effect two-way ANOVA that assessed the significance of differences in tumor growth over time between EGFP versus IDH1 KO and EGFP versus IDH2 KO tumors. P values: **P < 0.01, ***P< 0.001.

