Fig. 9.
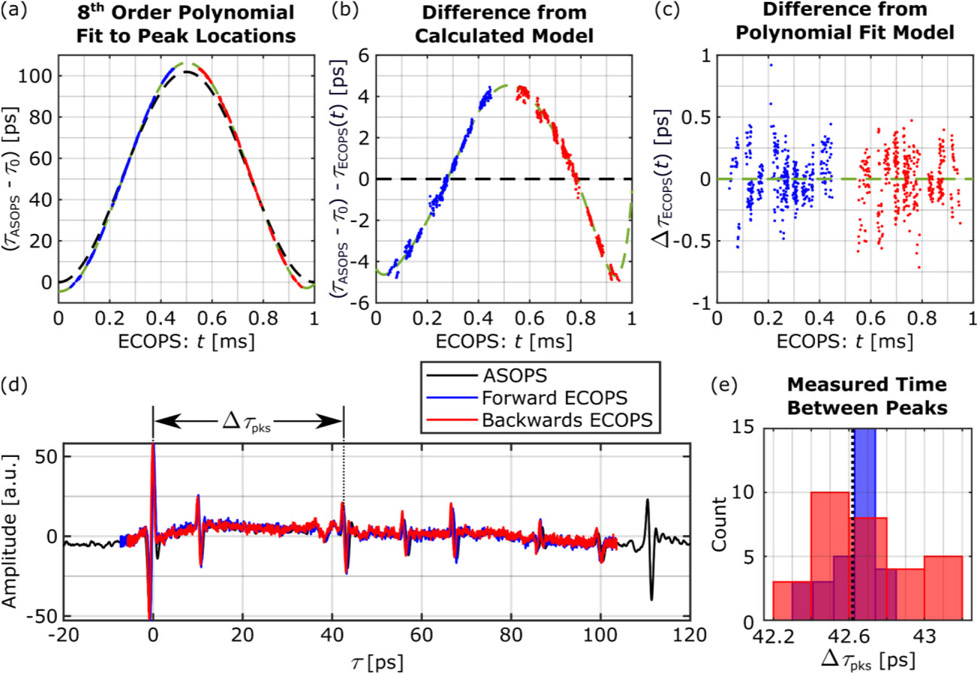
(a) Comparison between the model calculated from Eq. (7) (black dashed line) and polynomial fit (green dashed line) to the actual peak locations (blue and red points). Difference from the calculated model (b) and difference from the polynomial fit (c) highlighting the improved correspondence to ASOPS peak locations. (d) The corrected time domain signal and (e) measurement of Δτpks demonstrating that after nonlinear time-axis correction the ECOPS traces much more closely match each other and the ASOPS reference. The histogram data are obtained from 30 ECOPS measurements of the sample in Fig. 6.

