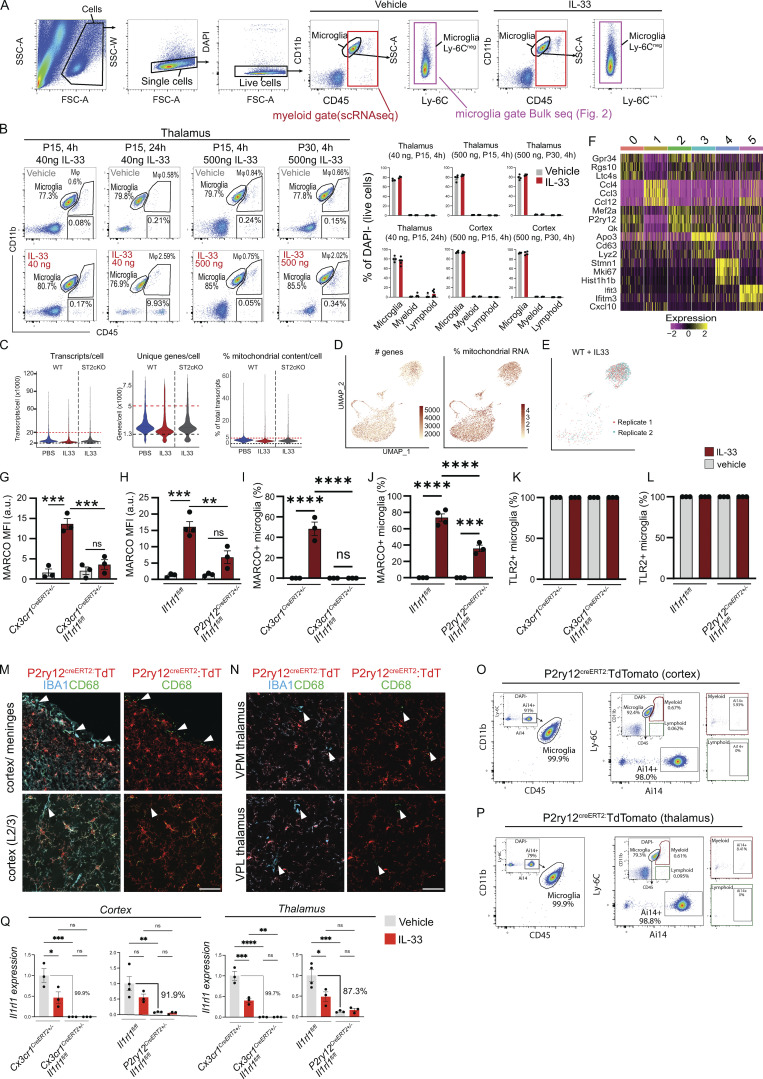
Figure S1.
Quality control of single-cell sequencing of microglial response to IL-33. (A) Gating strategy for isolation by FACS of all CD45+ (red) for scRNA-seq in Fig. 1, or microglia only (CD11b+, CD45low, Ly-6C−, violet) for bulk RNA-/ATAC-/ChIP-seq (Fig. 2). (B) Gating strategy showing microglia (CD45lowCD11b+), myeloid (CD45highCD11b+), and lymphoid cells (CD45+CD11b−) after vehicle or IL-33, gated on CD11b and CD45. Representative plots from thalamus, quantifications include thalamus and cortex. Dots = mice. (C) Violin plots of scRNA-seq data showing transcripts/cell, unique genes/cell, and percentage mitochondrial content/cell for each sample. Cut-off boundaries are marked (upper: red line; bottom: black line). (D) Feature plots for the number of genes and percentage mitochondrial RNA for all samples combined from scRNA-seq data. Each dot represents a cell. (E) Feature plot showing correlation between two replicates used for WT + IL-33 scRNA-seq sample. (F) Heatmap for the top three genes in each cluster from scRNA-seq data. (G and H) Mean fluorescence intensity for MARCO protein in cortex from Cx3cr1creERT2 (G) and P2ry12-creERT2 (H) mice. Dots = individual mice. Two-way ANOVA with Tukey’s post hoc comparison (genotype and treatment). (I and J) Percentage of microglia expressing MARCO protein in thalamus from Cx3cr1creERT2 (I) and P2ry12-creERT2 (J) mice. Dots = individual mice. Two-way ANOVA with Tukey’s post hoc comparison (genotype and treatment). (K and L) Percentage of microglia expressing TLR2 protein in thalamus from Cx3cr1creERT2 (K) and P2ry12-creERT2 (L) mice. Dots = individual mice. Two-way ANOVA with Tukey’s post hoc comparison (genotype and treatment). (M and N) Representative images for P2ry12creERT2 crossed to a R26R-TdTomato (TdT) reporter (Ai14). (M) Top row shows cortex with overlying meninges. Arrowheads indicate meningeal macrophages that are CD68+IBA1+TdT−. Bottom row shows L2/3 cortex. Arrowhead indicates perivascular macrophage that is CD68+IBA1+TdT−. (N) Ventral posteromedial (VPM; top) and ventral posterolateral (VPL; bottom) nuclei of thalamus. Arrowhead indicates perivascular macrophage that is CD68+IBA1+TdT−. Scale bar = 50 μm. (O and P) Representative flow plots of cortex (O) and thalamus (P) showing P2ry12creERT2 driven Ai14 (TdTomato) expression at P15. Two gating strategies shown: Left panel shows that of Ai14+ cells, 99.9% fell within the CD45/CD11b microglial gate. Right panels pre-gate on microglia, myeloid, and lymphoid cells based on CD11b and CD45 followed by Ly-6C and Ai14, to show the percentage of each population with detectable TdT. (Q) qRT-PCR of Il1rl1 expression in cortical and thalamic microglia comparing Cx3cr1creERT2 and P2ry12creERT2 mice. Values normalized to housekeeper (Hmbs) and then control + vehicle (PBS) condition. In Cx3cr1creERT2 the control = Cx3cr1creERT2+/− + vehicle (PBS). In P2ry12creERT2 the control = Il1rl1fl/fl + vehicle (PBS). Each dot represents a mouse. Two-way ANOVA followed by Tukey’s post hoc comparison (genotype and treatment). Data points represent the average of three technical repeats for Cx3cr1creERT and two technical repeats for P2ry12creERT. Data represented as mean ± SEM for bar graphs. *P < 0.05, **P < 0.01, ***P < 0.001, ****P < 0.0001.

