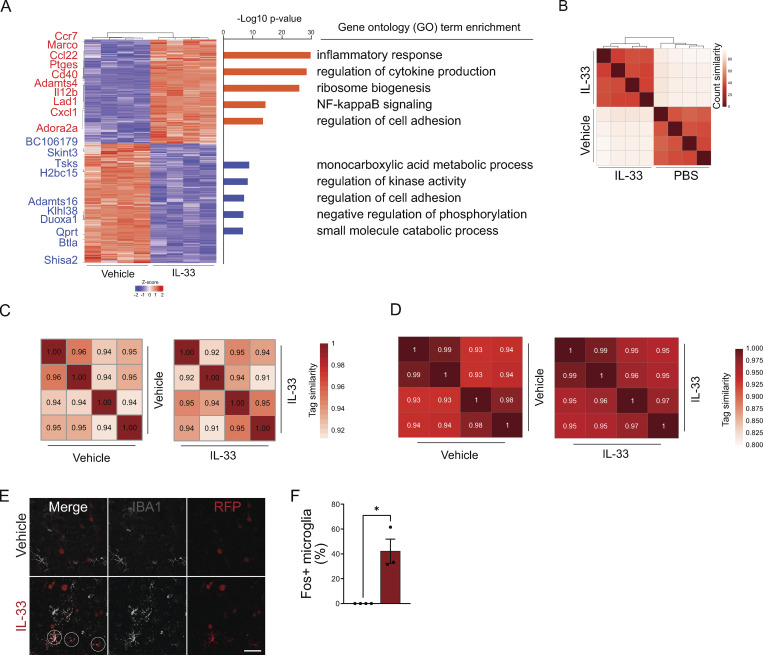
Figure S2.
Quality control for bulk transcriptomic and epigenomic profiling of microglia after IL-33 exposure. (A) Heatmap of differentially expressed genes (DEG) in cortical microglia 4 h after vehicle (PBS) or 500 ng of IL-33 treatment (Padj < 0.01). Left: Top 10 up- (red) and downregulated (blue) genes indicated. Right: Top GO categories associated with DEG (Padj < 0.01, fold-change > 2). (B) Heatmap of sample-to-sample Pearson correlation of bulk RNA-seq replicates. (C) Heatmaps of sample-to-sample correlation for ATAC-seq replicates. Values indicate Pearson correlation. (D) Heatmaps of sample-to-sample correlation for H2K27ac ChIP-seq replicates. Values indicate Pearson correlation. (E) Low magnification representative images of staining for Fos-TRAP (TdT+) after vehicle or IL-33 injection. Scale bar = 40 µm. (F) Percentage of Fos+ microglia in the cortex after vehicle or IL-33 injection. Dots = mice. Two-tailed unpaired t test. Data represented as mean ± SEM for F. *P < 0.05.

