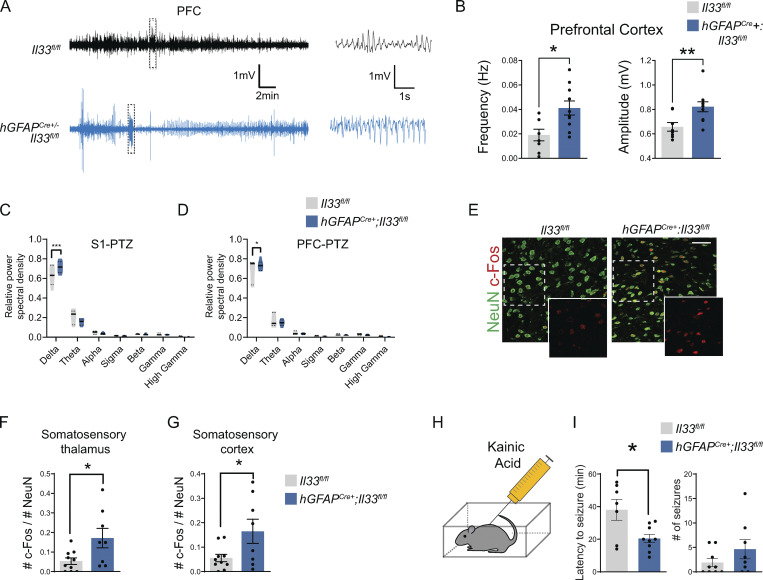
Figure S5.
Additional characterization of seizure phenotypes after conditional deletion of IL-33. (A and B) Representative traces and quantification of total spike frequency (left) and average amplitude (right) of detected spike events from prefrontal cortex during 1-h recording session. n = 10 hGFAPCre+;Il33fl/fl mice and n = 8 Il33fl/fl mice (two-tailed unpaired t test). Each dot represents a mouse. Mice were P35–P45. (C and D) Relative power of ECoG frequency bands from somatosensory (C) and prefrontal (D) cortices after PTZ administration (n = 10 IL-33 hGFAPCre+: IL33fl/fl mice and 8 littermate IL33fl/fl controls; two-way ANOVA followed by Sidak’s multiple comparison). (E–G) Representative images (E) in thalamus and quantification (F) of c-Fos expression in the thalamus and cortex (G) following PTZ administration (two-tailed unpaired t test). Scale bar = 50 µm. Dots = mice. (H) Schematic of kainic acid administration. (I) Quantification of latency to first seizure onset (left) and incidence of seizures (right) for 3 h following kainic acid administration from four independent experiments (two-tailed unpaired t test). All dots represent independent mice. Data represented as mean ± SEM for bar graphs and as median ± interquartile range for violin plots. Delta: 0.5–4 Hz; Theta: 4–8 Hz; Alpha: 8–12 Hz; Sigma: 12–15 Hz; Beta: 15–30 Hz; Gamma: 30–90 Hz; High Gamma: 90–150 Hz. *P < 0.05, **P < 0.01.

