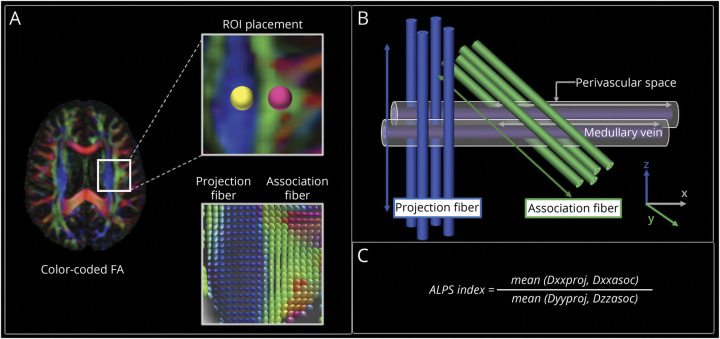
Figure 3. ALPS Index Calculation.
(A) Color-coded FA map showing the distribution of the projection fibers (z-axis, blue) and association fibers (y-axis, green) at the level of the lateral ventricle of the body. Spherical ROIs measuring 5 mm in diameter were placed in the projection and association areas. Diffusion tensor is shown as an ellipsoid in the lower row. (B) The schematic of the geometric positional relationship of the principal fiber and PVS runs parallel to the medullary vein. The PVS runs orthogonal to the projection and association fibers. (C) The ALPS index was calculated as the ratio of the mean of the x-axis diffusivity in the projection area (Dxx,proj) and x-axis diffusivity in the association area (Dxx,assoc) to the mean of the y-axis diffusivity in the projection area (Dyy,proj) and the z-axis diffusivity in the association area (Dzz,assoc).

