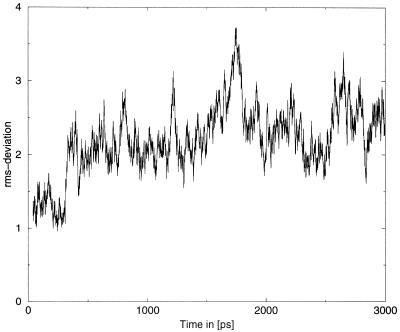
Figure 2.
The rms-deviation with respect to the X-ray starting structure in Å as function of time. The mean value over the whole simultion is 2.2 Å, which is the normal range for such molecular dynamics simulations. The rms-values show only the normal fluctuation indicating that the system is in equilibrium.

