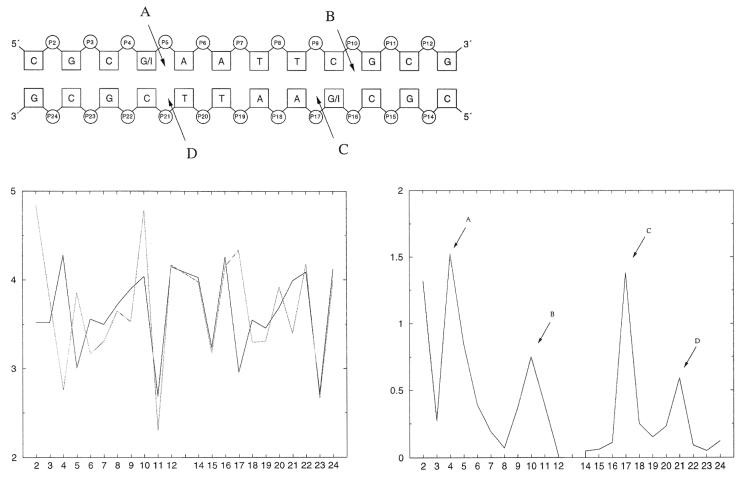
Figure 5.
The graph in the lower left shows the mean values over the simulations of the projected C1′ distances for the Drew Dickerson dodecamer (black) and for d(CGCIAATTCGCG)2 (gray). The lower right curve gives the absolute values of the differences in these destacking distances between the Drew Dickerson dodecamer and the respecitve d(CGCIAATTCGCG)2 inosine analog. The schematic picture on the top demonstrates the places of the largest differences, indicated by A–D.

