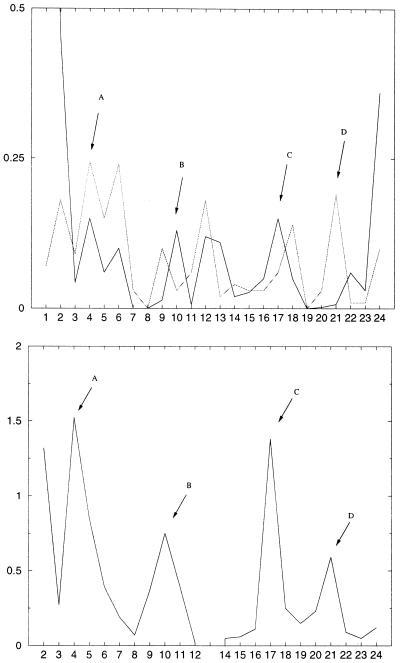
Figure 6.
The top plot shows the difference (absolute value), between the Drew Dickerson dodecamer and d(CGIAATTCGCG)2, in the hydration of O4′ (dotted line) and N3 (solid line). The mean value of number of water oxygens closer than 3.2 Å to O4′ and closer than 3.6 Å to N3 were used for detecting the hydration pattern. The bottom graph gives again the difference in the destacking interactions.

