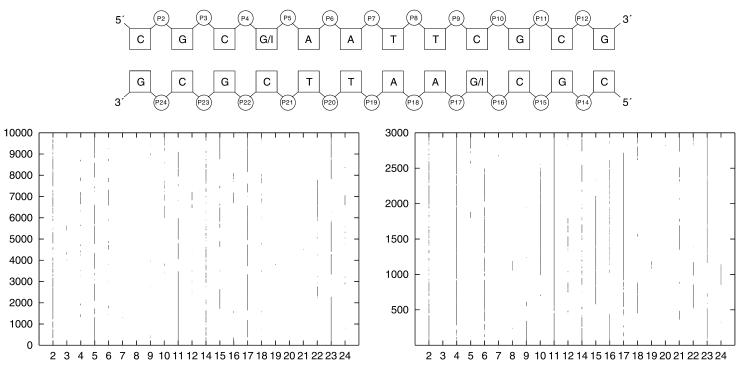
Figure 7.
The graph on the lower right shows the BI/BII pattern of d(CGCIAATTCGCG)2 dodecamer and the lower left graph indicates the behaviour of the d(CGCGAATTCGCG)2 Drew Dickerson dodecamer. The time the phosphate is in BII is marked by a line/dot. The schematic picture on the top gives the numbering scheme of the phosphates.

