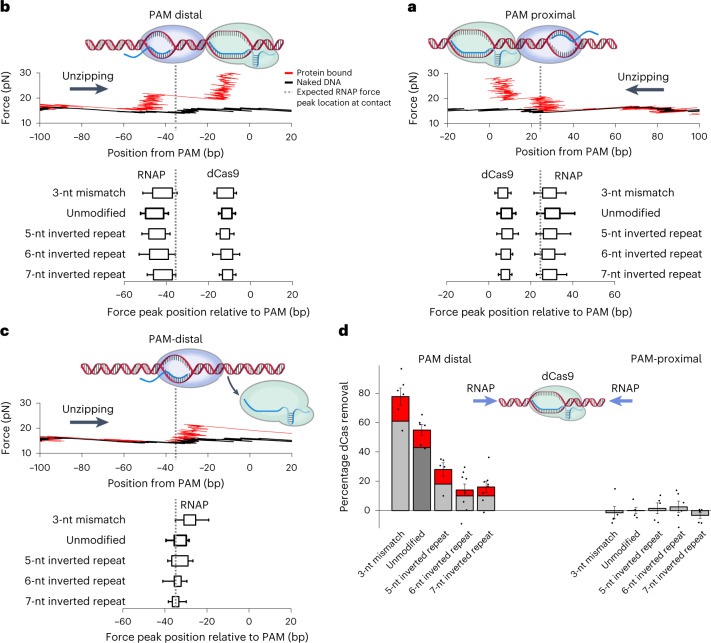
Fig. 5. The removal of dCas mediated by RNAP invasion of the dCas R-loop.
a, RNAP collision with dCas9 from the PAM-proximal side without dCas9 removal. Top, an example unzipping trace. Bottom, force peak locations of RNAP and dCas9. The dashed lines indicate the expected RNAP force peak position when RNAP contacts dCas9 (Extended Data Fig. 1a). Each box plot represents the 25th–75th percentiles of force peak positions of n biologically independent traces with error bars indicating s.d.: n = 88 (3-nt mismatch), n = 114 (unmodified), n = 103 (5-nt inverted repeat (IR)), n = 108 (6-nt IR) and n = 103 (7-nt IR). b, RNAP collision with dCas9 from the PAM-distal side without dCas9 removal. Top, an example unzipping trace showing the stalled RNAP and dCas9 force peaks. Bottom, force peak locations of RNAP after collision with dCas9. Each box shows the 25th–75th percentiles of force peak position distribution with error bars indicating s.d.: n = 14 (3-nt mismatch), n = 77 (unmodified), n = 83 (5-nt IR), n = 157 (6-nt IR) and n = 163 (7-nt IR). c, RNAP collision with dCas9 from the PAM-distal side with dCas9 being removed. Top, an example unzipping trace showing the stalled RNAP force peak with the dCas9 force peak being absent. Bottom, force peak locations of RNAP and dCas9. Each box shows the 25th–75th percentiles of force peak position distribution with error bars indicating s.d.: n = 23 (3-nt mismatch), n = 22 (unmodified), n = 12 (5-nt IR), n = 15 (6-nt IR) and n = 12 (7-nt IR). d, Efficiency of dCas9 removal with different gRNA modifications. The percentage with removal due to transcription read-through (gray, from Fig. 4c) and the percentage with removal but without read-through (red) are stacked. The percentage dCas removal values were calculated for each sample chamber (black dots), and the mean value and s.e.m. of these repeats are also shown. The same data as in Fig. 4c were used for this analysis, so the sample statistics are identical to those for Fig. 4c. Source data for a–d are provided.

