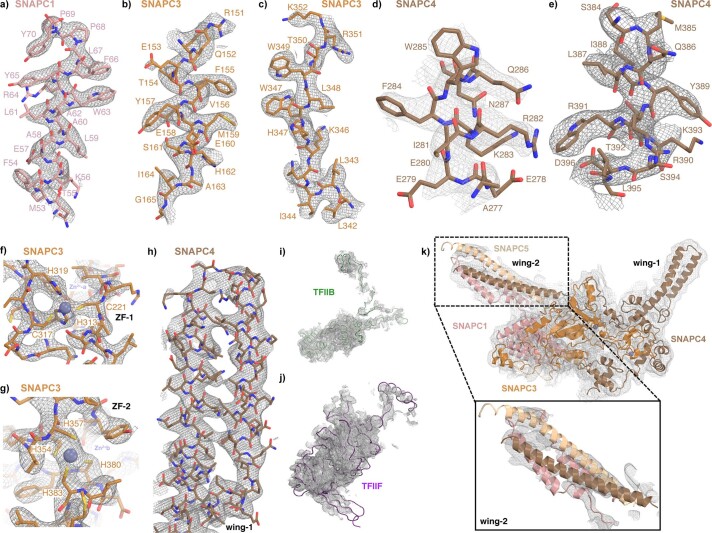
Extended Data Fig. 5. Map quality and map to model fit. Related to Fig. 3.
a-h) Sections of cryo-EM density of SNAPc subunits overlaid with their respective atomic models. Densities are shown as a grey mesh, and sticks are shown for the model as coloured in Fig. 3. i) cryo-EM density of the TFIIB subunit overlaid to the atomic within the SNAPc containing Pol II PIC bound to U1 promoter in OC state. j) cryo-EM density of a region of TFIIF subunit overlaid to the atomic model within the SNAPc containing Pol II PIC bound to U1 promoter in OC state. d) Local map of SNAPc containing Pol II PIC bound to U1 promoter in OC state is low pass filtered to 5 Å. The corresponding map is fitted with SNAPc subunits representing map to model fit, in particular the ‘wing-2’ region modelled using AlphaFold21.

