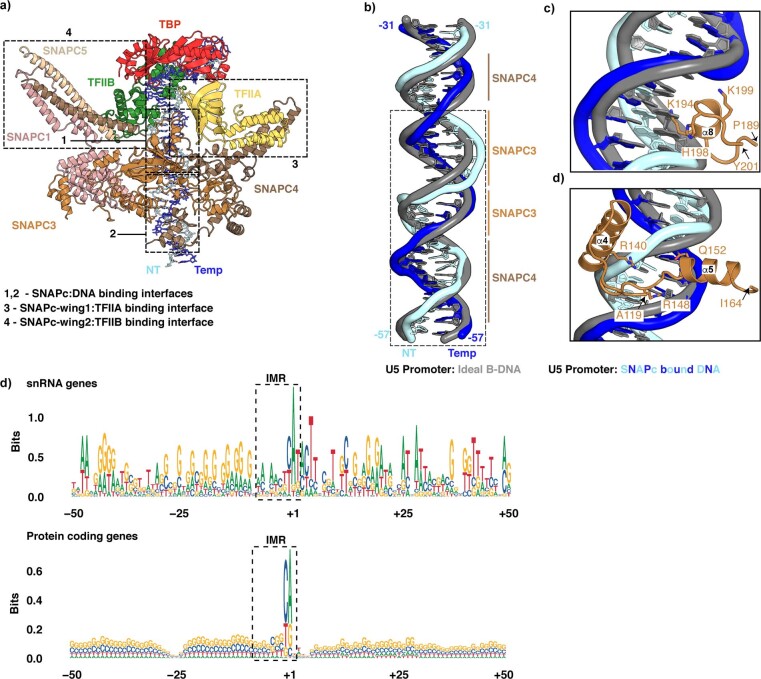
Extended Data Fig. 9. : Related to Figs. 4, 5 and 6.
Extended Data Fig. 8a) Birds-eye view of the SNAPc interaction with the GTFs’ and the PSE motif on U5 snRNA promoter. The dashed boxes indicate the observed interaction surfaces within the complex (1–4). b) Structural super-position of ideal B-DNA of U5 promoter to the SNAPc bound experimental DNA structure. Major and minor grooves of U5 promoter bound by SNAPC3 and SNAPC4are labelled and highlighted with lines. Dashed box indicates the PSE region. c) Close up view of SNAPC3 helix α8 binding to major groove of U5 promoter. The observed steric clash of K194 with B-DNA highlights the distortion upon SNAPc binding. d) Close up view of SNAPC3 helices α4, α5 region binding to minor groove of U5 promoter. The views in panels c and d correspond to Fig. 4b, c. e) Sequence logos of DNA sequence surrounding TSS peaks in expressed constitutive first/single exons for all snRNA genes (n = 18) and protein coding genes (n = 4721), sorted by TSS precision scores. The boxes indicate the IMR region (−8 to +2) of promoter flanking the TSS ( + 1). While the protein coding genes do not show any enrichment of specific nucleotides, snRNA genes present a AT-rich profile in the IMR region, indicating its tendency for spontaneous promoter opening.

