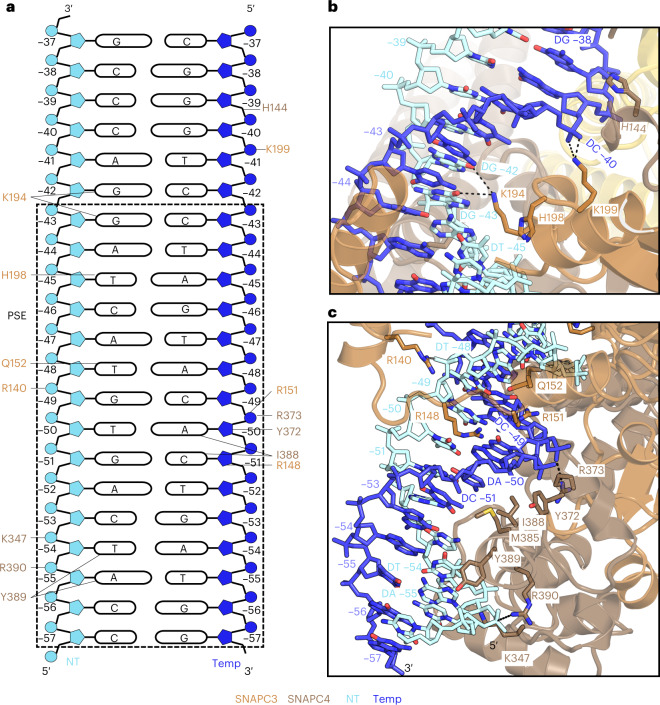
Fig. 4. SNAPc–DNA interactions.
a, Schematic view of the protein–DNA interactions between SNAPc and the PSE motif. Residues interacting with specific regions of the DNA, as described in the text, are indicated by lines. In panels b and c, the DNA is labelled and colour coded to indicate the register and the strands, respectively. b, DNA–protein interaction network on the preceding major and minor grooves (register: −46 to −35) of PSE, as bound by SNAPc subunits SNAPC3 and SNAPC4. Color codes are used uniformly in all panels. c, Close-up view of the first major and minor groove (register: −57 to −47) interactions between SNAPc and the PSE motif on the U5 promoter. The SNAPc subunits are represented as a cartoon, whereas the interacting amino acid side chain residues and DNA chains are depicted as sticks with atomic colors. Dashed lines indicate ionic interactions.

