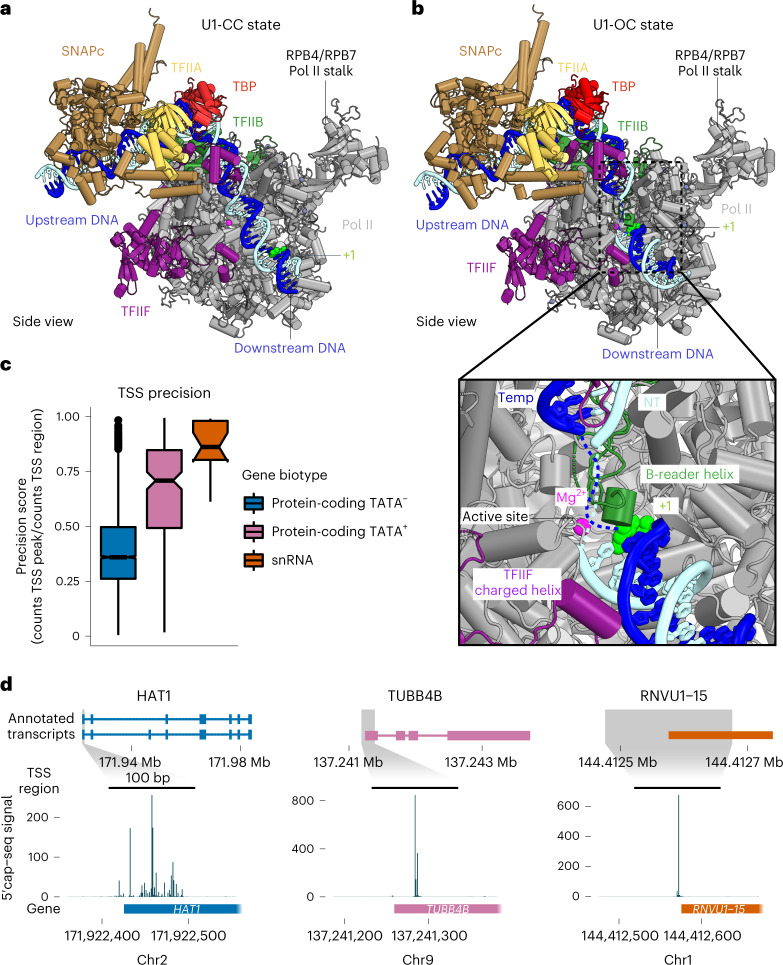
Fig. 6. Promoter opening.
a, Structure of SNAPc-containing Pol II PIC bound to U1 promoter in closed promoter complex (CC) state. The subunits are colored as in Figure 2. The nucleotide residue at the TSS (+1) on the template strand (blue) is represented as spheres (green). The Pol II active site metal ion A is depicted as a magenta sphere. b, Structure of SNAPc-containing Pol II PIC bound to U1 promoter in open promoter complex (OC) state. The inset represents a zoom into the active center containing open promoter DNA. The catalytic Mg2+ ion at the active site is represented as a magenta sphere. The B-reader helix of TFIIB and the charged helix of TFIIF are highlighted alongside the +1 nucleotide residue represented as a sphere (green). c, Box plots showing TSS precision of protein-coding and snRNA genes (n = 18) transcribed by Pol II in cells. Protein-coding genes are sub-grouped on the basis of promoter sequence into TATA-less (TATA–, n = 4,521) and TATA-containing (TATA+, n = 200) subsets. The thickened line represents the median value, the hinges correspond to the first and third quartiles, and the notches extend to 1.58 times the inter-quartile range divided by the square root of n. The whiskers represent the largest or smallest value within 1.5 times the inter-quartile range from the hinge, and outliers are shown in black. The precision scores were determined from published 5′ cap-seq data36 (Methods). d, Annotated transcripts of representative examples from subsets in c, and genome browser views showing the 5′ cap-seq signal in the magnified region (±100 bp), centered at the main TSS peak. The annotated gene region is shown below the views, and only the sense strand signal is shown.

