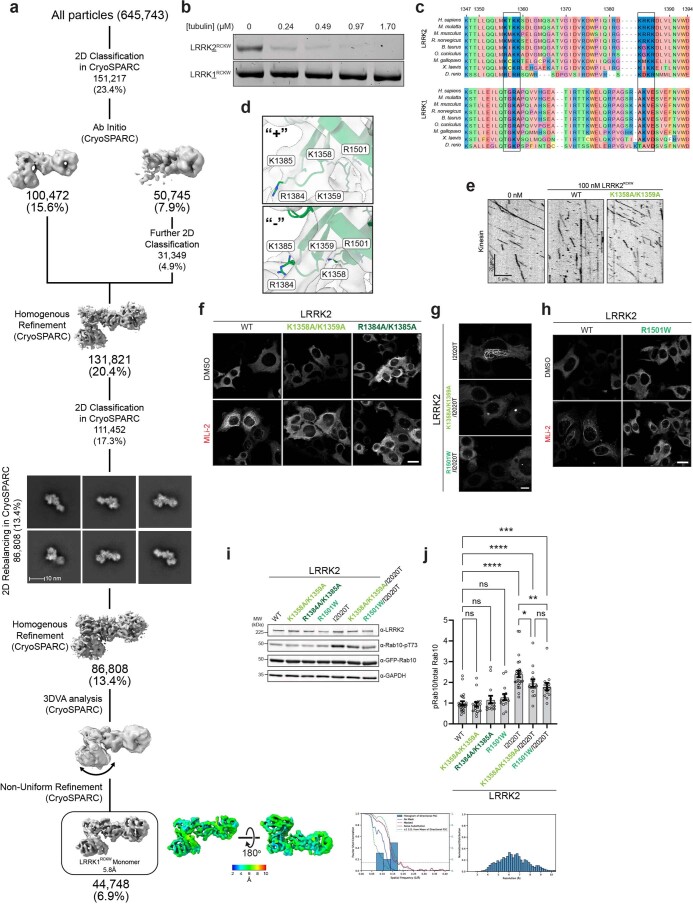
Extended Data Fig. 5. Basic residues within the LRRK2 ROC domain are not conserved in LRRK1 and are involved in LRRK2’s binding to microtubules.
a, Cryo-EM structure determination of LRRK1RCKW. Local resolution map, Fourier Shell Correlation, directional FSC plot, and the distribution of voxel resolutions are shown. b, Representative gel of supernatant from microtubule pelleting assay for 200 nM LRRK2RCKW or LRRK1RCKW with increasing tubulin concentrations. We performed 4 technical replicates. c, Sequence alignment of the ROC domains of LRRK2 and LRRK1 across several species made using Clustal Omega. Putative microtubule-contacting residues conserved in LRRK2 but not in LRRK1 are boxed. d, Close ups of the basic patches tested in this study, shown in the context of the cryo-EM maps for the ‘+’ and ‘−’ LRRK2RCKW monomers in our reconstruction of the microtubule-associated filaments (Fig. 1e, f). The models shown here correspond to those in Fig. 5c. e, Example kymographs of kinesin motility in the presence of 100 nM LRRK2RCKW (wild-type or K1358A/K1359A mutant). f, Representative images of 293 T cells expressing GFP-LRRK2 (wild type or ROC mutants) and treated with DMSO or 500 nM MLi-2 for 2 hours, corresponding to data plotted in Fig. 5g. Scale bar is 10 µm. g, Representative images of 293 T cells expressing GFP-LRRK2 (I2020T, I2020T/ROC mutant, or I2020T/R1501W), corresponding to data plotted in Fig. 5h, j. Scale bar is 10 µm. h, Representative images of 293 T cells expressing GFP-LRRK2 (wild type or R1501W mutant) and treated with DMSO or 500 nM MLi-2 for 2 hours, corresponding to data plotted in Fig. 5i. Scale bar is 10 µm. I, j, Rab10 phosphorylation in 293 T cells overexpressing WT LRRK2 or LRRK2 carrying the indicated mutations in the ROC domain. LRRK2[I2020T], which is known to increase Rab10 phosphorylation in cells, was tested as well. 293 T cells were transiently transfected with the indicated plasmids encoding for GFP-LRRK2 (wild-type or mutant) and GFP-Rab10. Thirty-six hours post-transfection the cells were lysed, immunoblotted for phospho-Rab10 (pT73), total GFP-Rab10, and total GFP-LRRK2. Quantification of immunoblotting data (i) is shown in (j) as ratios of pRab10/total GFP-Rab10 normalized to the average of all wildtype values. Individual data points represent separate populations of cells obtained across at least three independent experiments. Data are mean +/− s.e.m. ****p < 0.0001, ***p = 0.0004, **p = 0.0052, ***p = 0.0344, one-way ANOVA followed by a Fisher’s LSD test.

