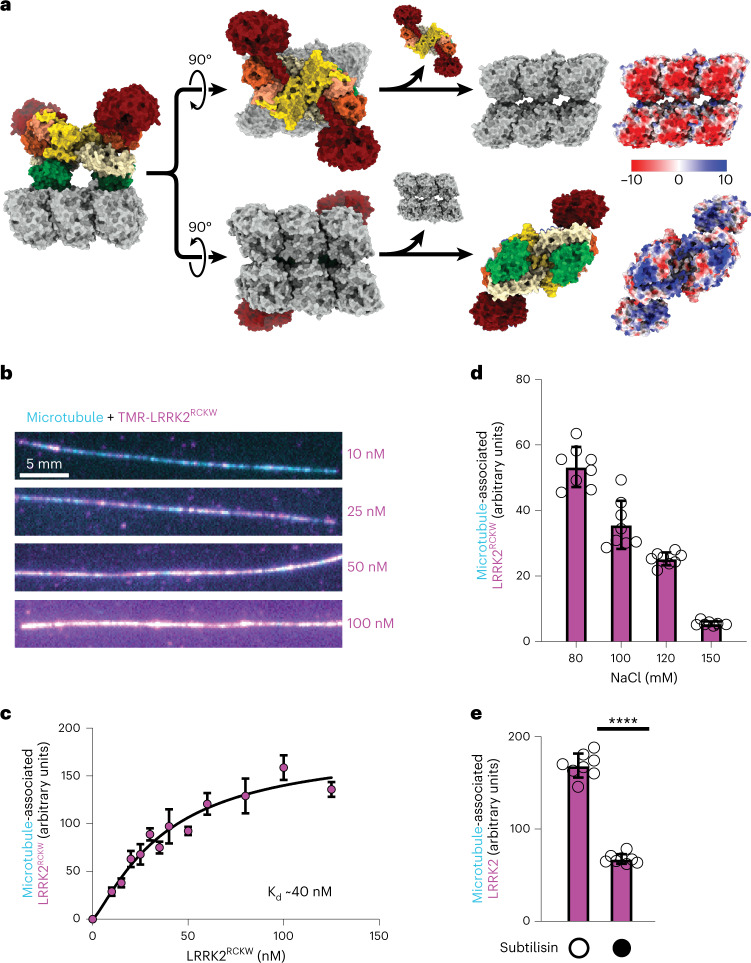
Fig. 3. LRRK2RCKW interacts with the microtubule via electrostatic interactions.
a, Charge distribution in the molecular model for microtubule-associated LRRK2RCKW filaments (Fig. 1). The model is shown in surface representation on the left and is then split to reveal the microtubule surface facing LRRK2RCKW (top) or the LRRK2RCKW surface facing the microtubule (bottom). The Coulomb potential of those surfaces is shown on the right. The acidic C-terminal tubulin tails that further contribute negative charge density to the microtubule are disordered in our structure and are not included here. b, Representative images of randomly labeled TMR-LRRK2RCKW (magenta), bound to microtubules labeled with Alexa Fluor 488 and tethered to a coverslip (cyan). The concentrations of TMR-LRRK2RCKW are indicated on the right. c, Quantification of data represented in b. Images were flatfield corrected, average TMR fluorescence intensity was measured along each microtubule in each field of view, and an average value per field of view was calculated, normalized for microtubule length. Data are mean ± s.d., n = 8 fields of view. d, Binding of 100 nM TMR-LRRK2RCKW to microtubules in the presence of increasing concentrations of sodium chloride, quantified from the assay exemplified by b. e, Binding of 50 nM TMR-LRRK2RCKW to microtubules untreated or pre-treated with subtilisin, quantified from the assay exemplified by b. Data are mean ± s.d., n = 8 fields of view. ****P < 0.0001, unpaired two-tailed t-test with Welch’s correction.

