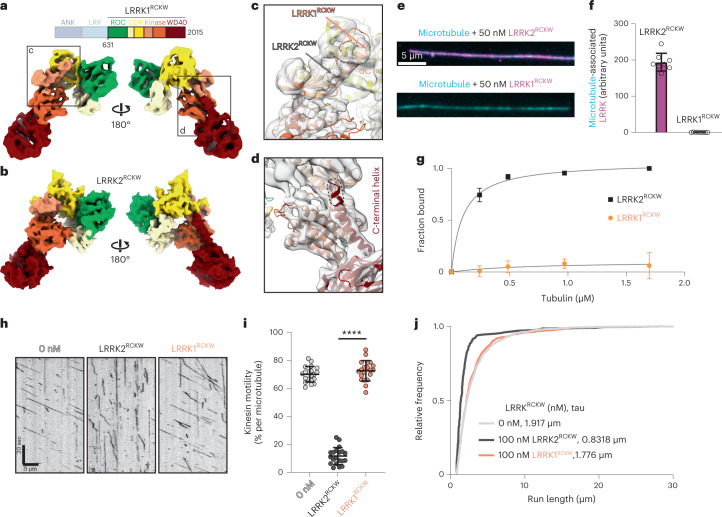
Fig. 4. LRRK1RCKW is structurally similar to LRRK2RCKW but does not bind to microtubules.
a, Cryo-EM map (5.8 Å) of a LRRK1RCKW monomer, with domains colored according to the scheme shown above. b, The molecular model for LRRK2RCKW (PDB: 6VNO) is shown as a calculated 6-Å density (molmap command in ChimeraX), in the same orientations used for LRRK1RCKW in a. c,d, Close-ups of the LRRK1RCKW map shown in a, with the AlphaFold model of LRRK1 docked into it. These close-ups highlight the difference in length in the αC helix between LRRK1 and LRRK2 (c), and a difference at the C-terminal helix emerging from the WD40 domain between our experimental map of LRRK1RCKW and the AlphaFold model of LRRK1 (d). e, Representative images of Alexa Fluor 488-labeled microtubules (cyan) incubated with 50 nM of either LRRK2RCKW (magenta, top) or LRRK1RCKW (magenta, bottom). f, Quantification of data in e, as outlined in Figure 3c. Data are mean ± s.d., n = 8 fields of view. g, Microtubule pelleting assay for 200 nM LRRK2RCKW or LRRK1RCKW with increasing tubulin concentrations. Data are mean ± s.d., n = 4. The solid lines represent a hyperbolic curve fit to the data. h, Example kymographs for single-molecule kinesin motility assays alone or in the presence of 100 nM of either LRRK2RCKW or LRRK1RCKW. i, Quantification of data in h as percentage of motile kinesin events per microtubule. Data are mean ± s.d. ****P < 0.0001, Kruskal–Wallis test with Dunn’s post hoc for multiple comparisons. j, Cumulative distribution of run lengths for kinesin in the absence or presence of 100 nM LRRK2RCKW or LRRK1RCKW. The run lengths were not significantly different between 0 nM and 100 nM LRRK1RCKW conditions (Kruskal–Wallis test with Dunn’s post hoc for multiple comparisons). Data are from two biological replicates, with three or two technical replicates of each experiment.

