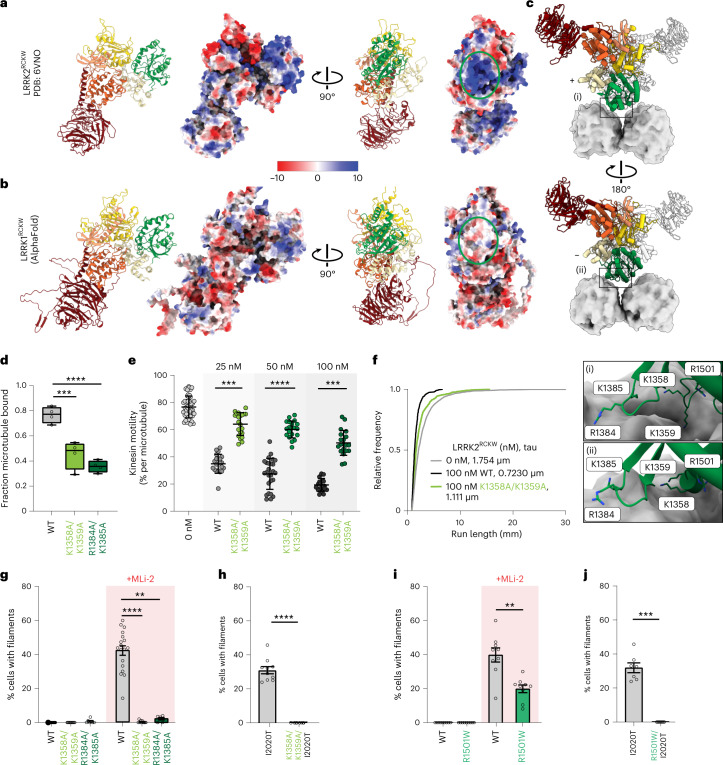
Fig. 5. Basic patches in the ROC domain are involved in LRRK2’s binding to microtubules.
a,b, Surface charge distribution (Coulomb potential) for LRRK2RCKW (PDB: 6VNO) (a) and the AlphaFold model for LRRK1RCKW (b). The green oval on the right highlights the region in the ROC domain facing the microtubule in the filament structure where basic patches are present (and conserved) in LRRK2 but absent in LRRK1. c, Molecular model of the microtubule-bound LRRK2RCKW filament with tubulin, shown in surface representation. ‘+’ and ‘−’ indicate the two monomers in a dimer. Close-ups, shown as insets labeled (i) and (ii) below the structures, highlight basic residues near the microtubule surface tested here. d, Binding of LRRK2RCKW, either WT or carrying mutations in the ROC domain’s basic patches, to microtubules using a microtubule pelleting assay. Box and whisker plot center line denotes the median value, and whiskers denote minimum and maximum values. ***P = 0.0006, ****P < 0.0001, one-way ANOVA with Dunnett’s multiple comparisons test. n = 4 replicates. e, Single-molecule motility assays for kinesin alone or in the presence of increasing concentrations of either WT LRRK2RCKW or LRRK2RCKW carrying mutations in the ROC domain. Inhibition of kinesin motility was quantified as percentage of motile events per microtubule. Data points represent individual microtubules obtained across at least two independent experiments. Data are mean ± s.d. ***P < 0.0002, ****P < 0.0001, Kruskal–Wallis test with Dunn’s post hoc for multiple comparisons. f, Cumulative distribution of run lengths for kinesin in the absence or presence of 100 nM LRRK2RCKW (WT or carrying ROC mutations). Run lengths were significantly different between 100 nM WT LRRK2RCKW and LRRK2RCKW-K1358A K1359A (Kruskal–Wallis test with Dunn’s post hoc for multiple comparisons). Mean decay constants (tau) are shown. g, Quantification of microtubule-associated filament formation in cells expressing WT GFP-LRRK2, GFP-LRRK2-K1358A K1359A, or GFP-LRRK2-R1384A K1385A in the absence or presence of MLi-2. Data are mean ± s.e.m. **P = 0.0022, ****P < 0.0001, Kruskal–Wallis test with Dunn’s post hoc for multiple comparisons. h, Quantification of microtubule-associated filament formation in cells expressing GFP-LRRK2-I2020T or GFP-LRRK2-K1358A K1359A I2020T. Data are mean ± s.e.m. ****P < 0.0001, two-tailed Mann–Whitney test. i, Same as for g for a recently identified PD-linked mutation in the ROC domain (p.R1501W). Data are mean ± s.e.m. **P = 0.0017, two-tailed Mann–Whitney test. j, Same as for h for GFP-LRRK2-I2020T and GFP-LRRK2-R1501W I2020T. Data are mean ± s.e.m. ***P = 0.0002, two-tailed Mann–Whitney test. Individual data points in g–j represent separate coverslips of cells obtained across at least four independent experiments.

