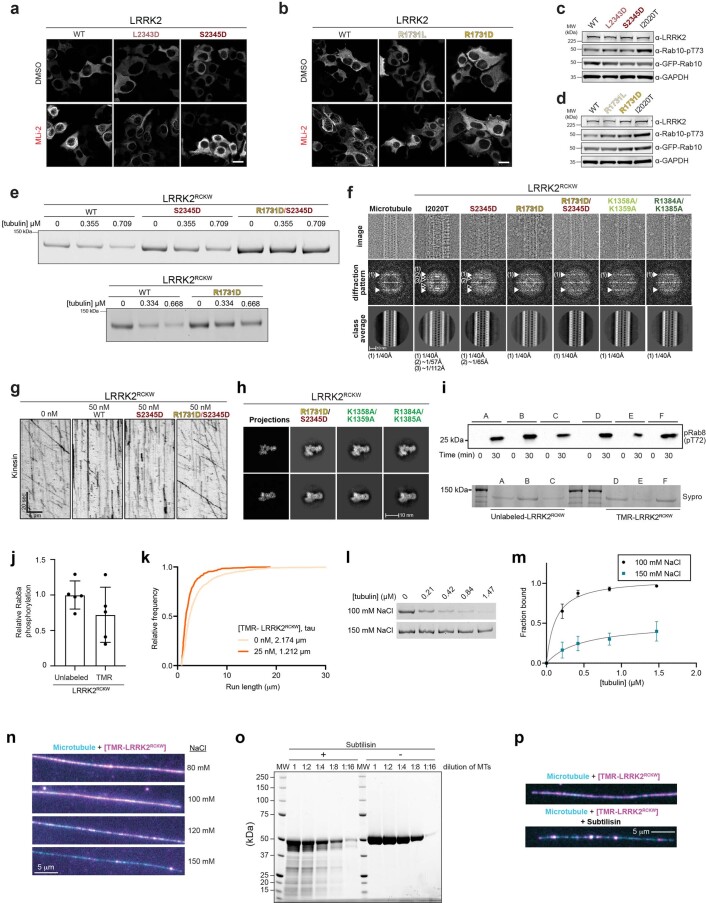
Extended Data Fig. 4. Mechanism of LRRK2RCKW binding to microtubules.
a, Representative images of 293 T cells expressing GFP-LRRK2 (wild-type or the WD40 mutants L23443D and S2345D) and treated with DMSO or 500 nM MLi-2 for 2 hours. Scale bar is 10 µm. b, Representative images of 293 T cells expressing GFP-LRRK2 (wild-type or the COR-B mutants R1731L and R1731D) and treated with DMSO or 500 nM MLi-2 for 2 hours. Scale bar is 10 µm. c,d, Rab10 phosphorylation in 293 T cells overexpressing WT LRRK2 or LRRK2 carrying mutations in the WD40 (c) or COR-B (d) domains. LRRK2[I2020T], which is known to increase Rab10 phosphorylation in cells, was tested as well. 293 T cells were transiently co-transfected with the indicated plasmids encoding for GFP-LRRK2 (wild type or mutant) and GFP-Rab10. Thirty-six hours post-transfection the cells were lysed, immunoblotted for phospho-Rab10 (pT73), total GFP-Rab10, and total GFP-LRRK2. Quantification of data in (c) and (d) is shown in Fig. 2d, f, respectively. e, A representative gel of the supernatants from the microtubule pelleting assays used to generate the data shown in Fig. 2g. f, Cryo-EM analysis of filament formation in vitro by LRRK2RCKW mutants. Top row, cryo-EM images of an individual microtubule (left) or combinations of microtubules and LRRK2RCKW mutants. Middle, Diffraction patterns calculated from the images above. Arrowheads point to layer lines arising from the microtubule (white) or from the LRRK2RCKW filaments (open), and their frequencies are indicated below the images. Bottom, 2D class averages from multiple images equivalent to those shown at the top. g, Example kymographs of single-molecule kinesin motility assays in the presence or absence of 50 nM LRRK2RCKW wild-type or indicated mutant. h, Comparison of 2D class averages from cryo-EM images of different LRRK2RCKW mutants with the corresponding 2D projection from a LRRK2RCKW molecular model (PDB: 6VNO). Two different views are shown for each mutant. i, Representative in vitro kinase reaction. Rab8a phosphorylation was measured via western blotting with a phospho-T72-specific Rab8a antibody, and total LRRK2RCKW concentration was measured by Sypro Red staining. Phosphorylation reactions were terminated after 30 minutes. j, Quantification of data shown in (i). For each reaction, phospho-Rab8a band intensity (chemiluminescence) was divided by LRRK2RCKW band intensity (Sypro red); for each western blot, an average normalized value was calculated for all replicates of unlabeled LRRK2RCKW, and all data was then normalized to this value. Data are mean +/− s.d., n = 5 replicates, p=ns, two-tailed unpaired t-test. k, Cumulative distribution of run lengths for kinesin in the absence or presence of 25 nM TMR-LRRK2RCKW. The run lengths were significantly different between 0 nM and 25 nM TMR-LRRK2RCKW (Mann-Whitney test). Mean decay constants (tau) are shown. The effect on kinesin motility is similar to that previously shown using unlabeled LRRK2RCKW. l, m, Representative microtubule pelleting assay gel for LRRK2RCKW in the presence of 100 mM and 150 mM sodium chloride. Co-sedimentation was measured as depletion from the supernatant. For each reaction, 200 nM LRRK2RCKW was mixed with a given concentration of microtubules, microtubules were pelleted by a high-speed spin, and a gel sample was taken of the supernatant. Quantification of data represented in (l) is shown in (m). Data are mean ± s.d., n = 4. The solid line represents a hyperbolic curve fit to the data. n, Representative images of coverslip-tethered Alexa Fluor 488-labeled MTs (cyan) bound to 100 nM TMR-LRRK2RCKW (magenta) in the presence of increasing concentrations of sodium chloride, used to generate the data in Fig. 3d. o, Subtilisin treatment of taxol-stabilized microtubules. Serial dilutions of taxol-stabilized microtubules were treated with subtilisin (left) or left untreated as a control (right). The experiment was performed twice with similar results. p, Representative images of untreated (top) and subtilisin-treated (bottom) Alexa Fluor 488-labeled MTs (cyan) bound to 50 nM TMR-LRRK2RCKW (magenta), used to generate the data shown in Fig. 3e.

