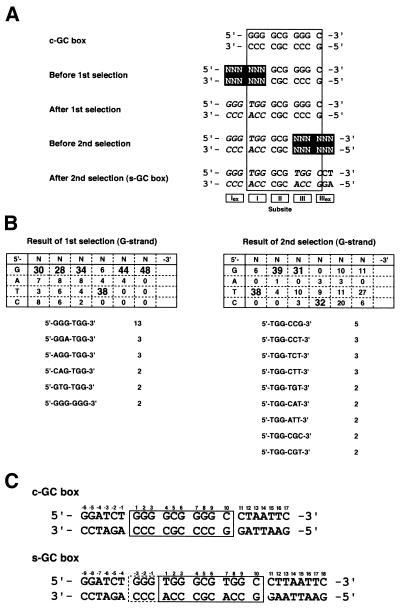
Figure 2.
(A) DNA sequences in the SAAB experiment. The sequences are divided into five subsites, Iex to IIIex. Randomized regions and the bases highly selected by peptide binding are highlighted and italicized, respectively. (B) The results of SAAB with two selection steps. The bases that have selectivity relative to neighboring bases are in large font in the table. The numbers of the selected sequences are shown below the table. (C) The sequences of the c-GC and s-GC boxes. Relative positions of the bases are indicated by numerals.

