Fig. 2.
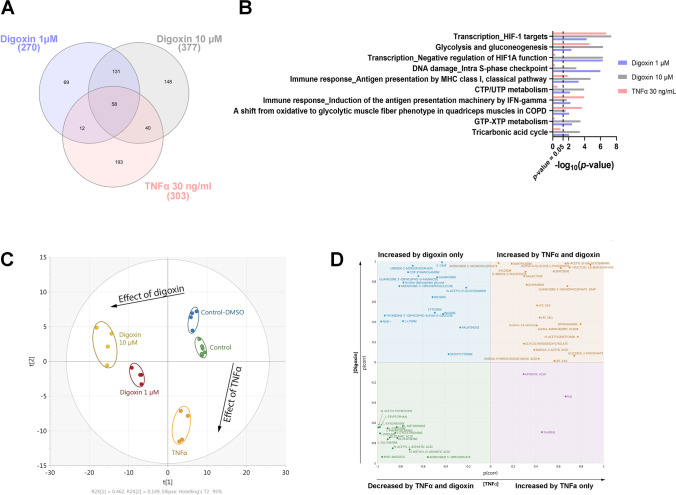
Proteomics and metabolomics profiling of human astrocytes after digoxin and TNFα exposure. A Venn diagram of differentially expressed proteins after 24-h exposure to digoxin (1 and 10 µM) or TNFα 30 ng/mL. B Top ten enriched biological protein pathways provided by MetaCore™ software from the lists of changing proteins (|FC|> 1.2, p value ≤ 0.05, N = 3) after exposure to digoxin (1 and 10 µM) or TNFα 30 (ng/mL). The X-axis corresponds to − log10(p value); the Y-axis corresponds to the biological pathways. Vertical line represents the p value cut-off of 0.05. C PCA of metabolites measured by 3 LC–MS approaches, changing after exposure to digoxin (1 and 10 µM) vs control-DMSO or TNFα 30 ng/mL vs control. D SUS plot for comparison of metabolomic differences and similarities between the effects of digoxin and TNFα

