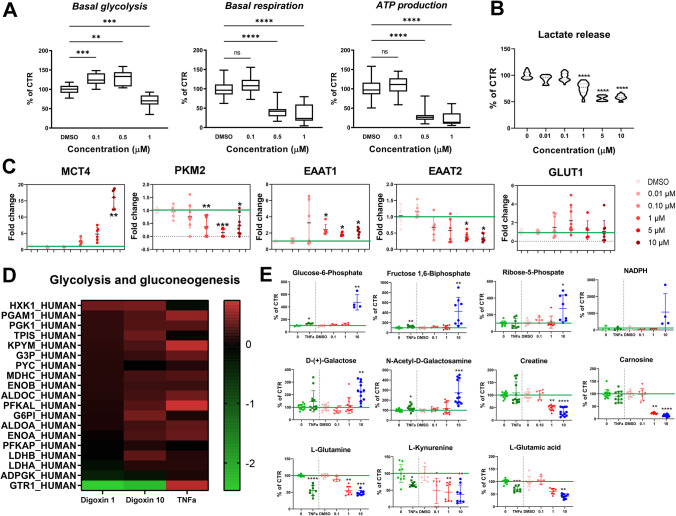
Fig. 5.
Digoxin-induced changes in energy metabolism. A Basal glycolysis rate, basal respiration, and ATP production after digoxin (0.1 (n = 31), 0.5 (n = 14) and 1 µM (n = 36)). B Lactate release after 24 h of exposure to digoxin. C Relative mRNA levels of genes involved in energy metabolism after 24 h of exposure to digoxin. For each group, n = 9–12 samples obtained in 3 independent experiments. D Heatmap of significantly changed proteins (Log2 FC) of the glycolysis pathway after 24 h of exposure to digoxin (1 and 10 µM) or TNFα (30 ng/mL). E Relative levels of metabolites involved in energy metabolism after 24 h of exposure to digoxin or TNFα. Statistical analysis for the effects of digoxin was performed using the non-parametric Kruskal–Wallis test followed by Dunn’s multiple comparison test and for the effects of TNFα using Mann–Whitney test. *p < 0.05, ** p < 0.01, *** p < 0.001, **** p < 0.0001

