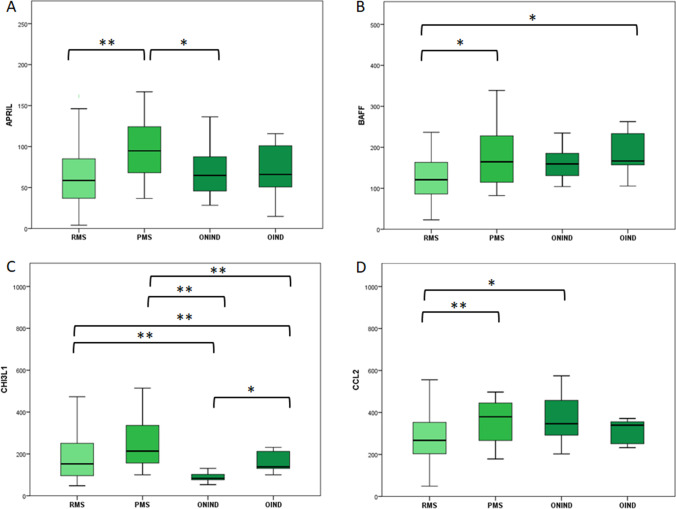
Fig. 1.
CSF concentration of APRIL (A), BAFF (B), CHI3L1 (C), and CCL2 (D) for each study group in pg/ml except for CHI3L1 measured as ng/ml. The boxes represent median and interquartile range. Statistical differences between groups were highlighted: a singler asteris (*) for p-value < 0.05 and double asterisks (**) for p-value < 0.01. Comparisons of CSF biomarkers concentration between multiple groups were explored with ANOVA for APRIL, BAFF, and CCL-2 and with Kruskal–Wallis for CHI3L1. Comparisons between two independent groups were assessed through Student T-test for APRIL, BAFF, and CCL-2 and with Mann–Whitney test for CHI3L1. RMS, relapsing multiple sclerosis; PMS, progressive multiple sclerosis; ONIND, other non-inflammatory neurological disorders; OIND, other inflammatory neurological disorders

