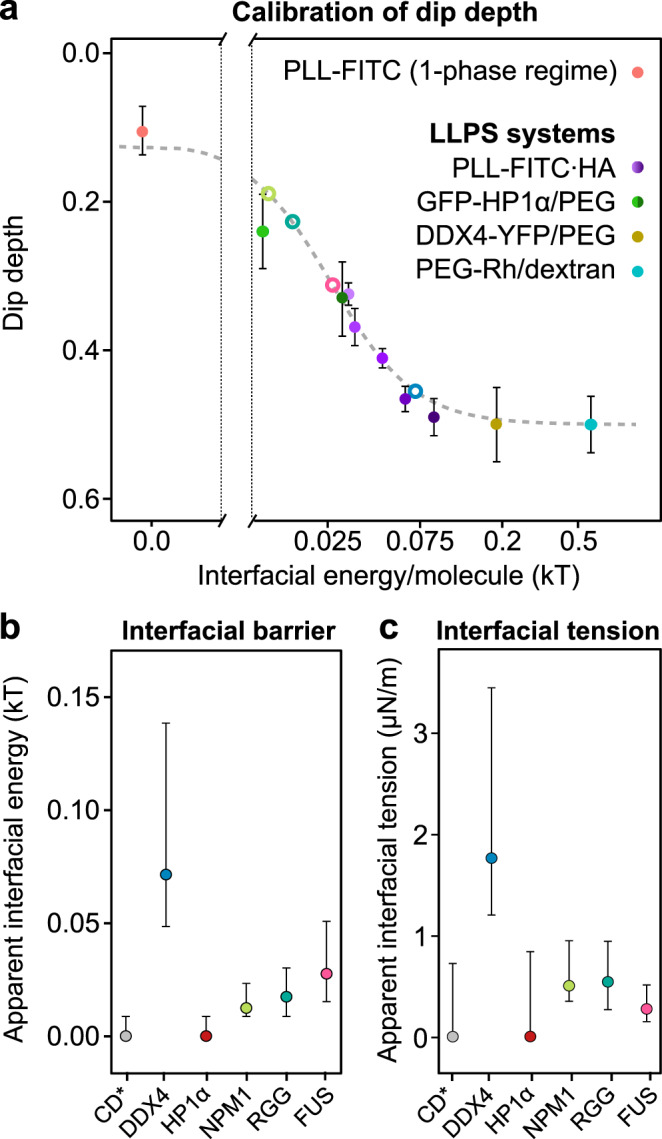
Fig. 4. MOCHA-FRAP quantifies interfacial barriers based on the dip depth.

a Relationship between dip depth and interfacial energy per molecule for PLL-HA undergoing LLPS (violet; magnesium chloride concentrations increase from dark to light color), GFP-HP1α/PEG (dark green: without ssDNA; light green: with ssDNA), DDX4-YFP/PEG (gold) and PEG-Rhodamine/dextran (cyan) measured in vitro. As a reference, free PLL in the 1-phase regime is shown (red). The error bars represent the standard error of the mean. Open circles represent dip depths obtained in live-cell experiments, following the same color code as in the panels below. Apparent interfacial energy per molecule, which serves as a proxy for the interfacial barrier (b), and apparent interfacial tension (c) calculated from the dip depth of CD*-YFP, DDX4-YFP, GFP-HP1α, NPM1-GFP, RGG-GFP-RGG and FUS-mCherry in living cells, using the calibration curve in panel a. Error bars represent the standard error of the mean. Source data are provided as a Source Data file.
