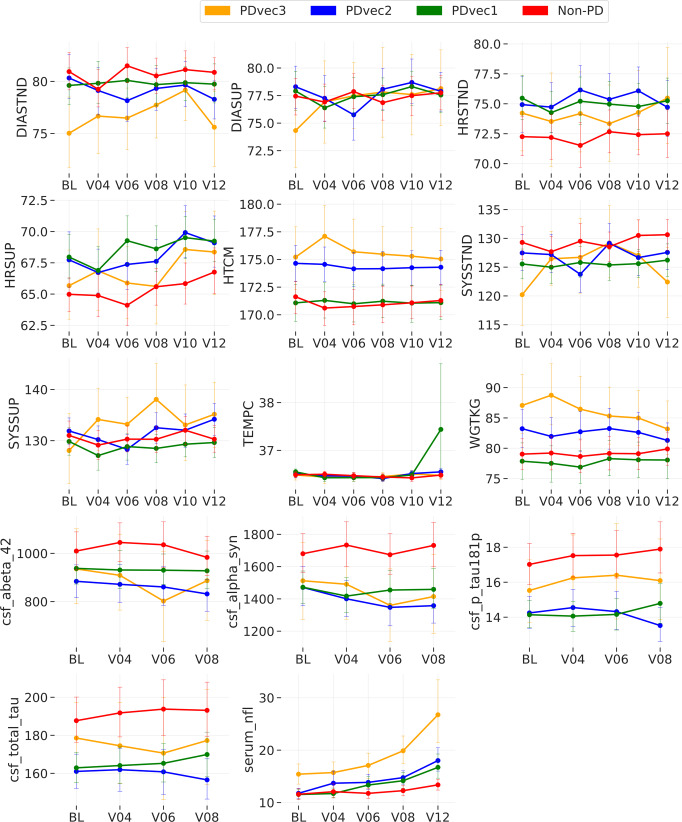
Fig. 4. Shows the biological biomarker variation of each PD subtype over time.
The graphs demonstrate the actual clinical values of each subtype overtime for vital signs (DIASTND standing diastolic blood pressure (BP), DIASUP supine diastolic BP, HRSTND standing heart rate, HRSUP supine heart rate, SYSSTND standing systolic BP, SYSSUP supine systolic BP, HTCM height in cm, TEMPC: temperature in C, WGTKG weight in kg), cerebrospinal fluid (abeta_42 β-amyloid 1–42, alpha_syn alpha-synuclein, p_tau181p phospho-tau181, total_tau total tau protein), and serum neurofilament light levels (serum_nfl). BL: Baseline. V04 visit number 4 after 12 months. V06: visit number 6 after 24 months. V08 visit number 8 after 36 months. V10 visit number 10 after 48 months. V12 visit number 12 after 60 months. In all panels, data is presented as mean ± s.e.m.

