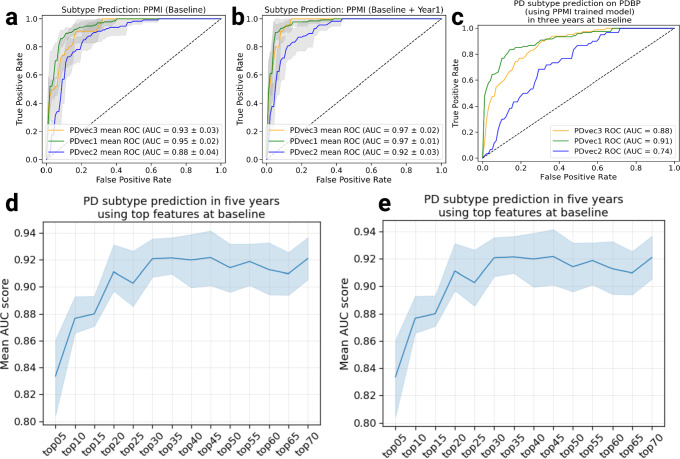
Fig. 6. Shows the performance of Parkinson’s disease progression prediction models.
a The ROC (receiver operating characteristic) for the predictive model at baseline developed on the PPMI cohort evaluated using five-fold cross-validation. b The ROC for the predictive model developed on the baseline, and first-year data of the PPMI cohort evaluated using five-fold cross-validation. c The ROC for the predictive model developed on the PPMI baseline and tested on the PDBP cohort. d Performance of predictive models using data starting from baseline, only using baseline data, and years after, as more data becomes available and combined with the baseline. The y-axis shows the average AUC score across PD subtypes in the PPMI dataset. e Contribution of important features to achieve high accuracy. By including only 20 features, we can achieve an AUC of greater than 0.90. In all panels, data is presented as mean ± s.e.m.

