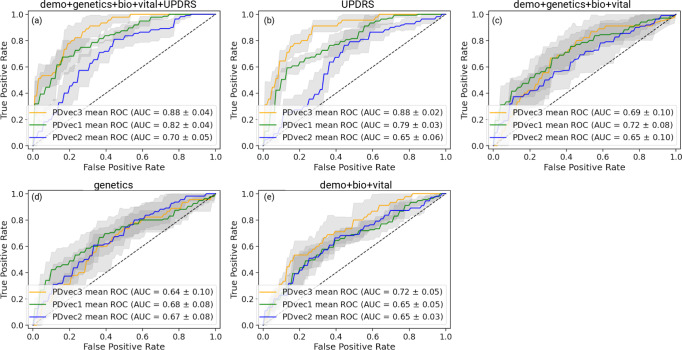
Fig. 7. Shows the performance of Parkinson’s disease progression prediction models using biomarkers and genetic measurements for the PPMI cohort.
All models are evaluated using five-fold cross-validation. From top left to bottom right: a The ROC for the predictive model using a combination of demographics (education, year, sex, race), biospecimen (cerebrospinal fluid, serum Nfl levels), genetics (hg genotype), vital signs (weight, height, blood pressure) and UPDRS measurements. b The ROC for the predictive model developed on UPDRS scores. c The ROC for the predictive model developed using demographics, genetics, vital signs, and biospecimen measurements. d The ROC for the predictive model developed on genetic measurements e The ROC for the predictive model uses only demographics, vital signs, and biospecimen measurements. In all panels, data is presented as mean ± s.e.m.

