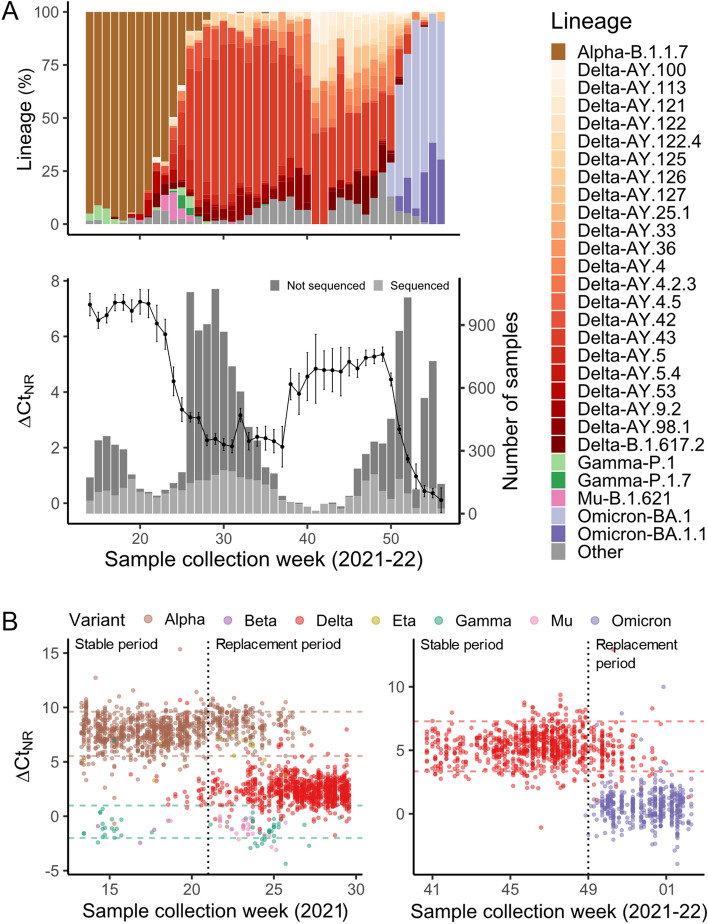
Figure 2.
Temporal evolution of ∆CtNR registered viral variant replacements. (A) Top: Weekly temporal evolution of SARS-CoV-2 lineages as per WGS results. Bottom: Weekly number of high-quality RT-PCR samples are indicated with bars (shades of grey indicate availability of WGS results). Weekly temporal evolution of ∆CtNR is depicted by a line-dot trend with standard error shown in bars. (B) Models for variant classification during Alpha-Delta transition (left) and Delta-Omicron transition (right). Data used for model construction is shown in the stable period while data used for model evaluation is used on the replacement period. Each sub-dataset is separated by a vertical dotted line. Cut-off values determined at the 5th and 95th percentile values of circulating variants during the stable period are indicated by horizontal dashed lines colored according to each variant.

